-
DARTS: Multi-year database of AI detected retrogressive thaw slumps (RTS) and active layer detachment slides (ALD)...
This dataset, called DARTS, comprises footprints of retrogressive thaw slump (RTS) and active layer detachments slides (ALD) identified and quantified using an automated deep... -
Developing and Testing a Deep Learning Approach for Mapping Retrogressive Thaw Slumps (CA, RU)
In a warming Arctic, permafrost-related disturbances, such as retrogressive thaw slumps (RTS), are becoming more abundant and dynamic, with serious implications for permafrost... -
Rockglacier and Slope Instability Inventory from differential SAR interferograms and optical imagery, 1998-2016,...
Rockglaciers and other periglacial processes were mapped using visual analysis of differential SAR interferograms and satellite optical images (Google Satellite, Bing Aerial)... -
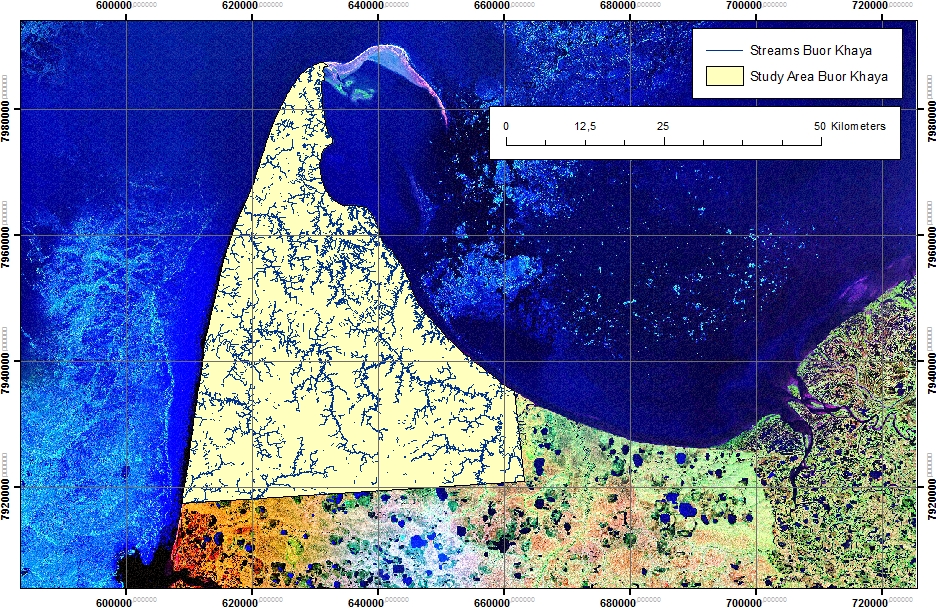
Thermo-erosional valleys and streams in ice-rich permafrost lowlands from RapidEye, 2010, Buor Khaya Peninsula,...
The published data set provides an inventory of thermo-erosional landforms and streams in three lowland areas underlain by ice-rich permafrost of the Yedoma-type Ice Complex at... -
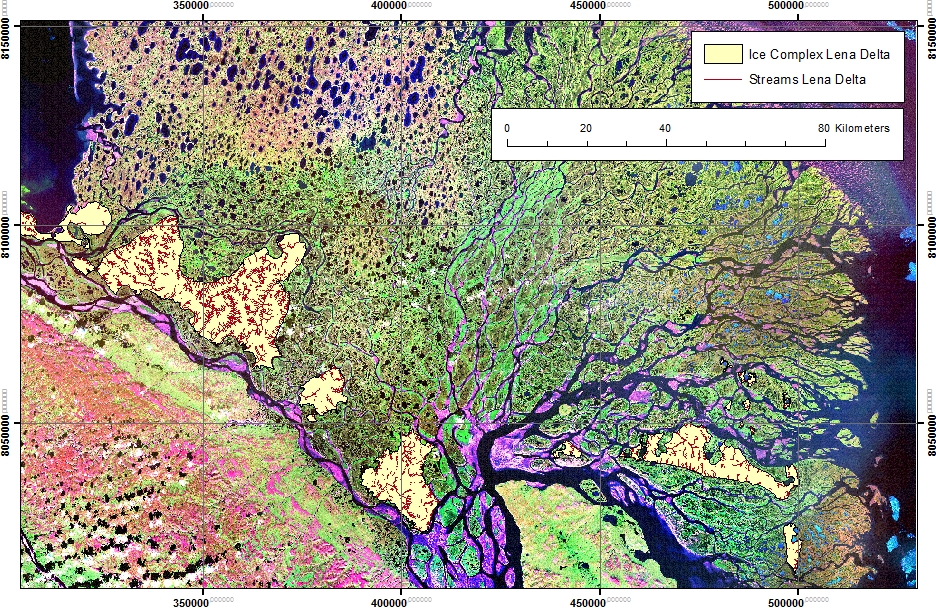
Thermo-erosional valleys and streams in ice-rich permafrost lowlands from Landsat, 2000, Hexagon, 1975, Lena Delta,...
The published dataset provides an inventory of thermo-erosional landforms and streams in three lowland areas underlain by ice-rich permafrost of the Yedoma-type Ice Complex at... -
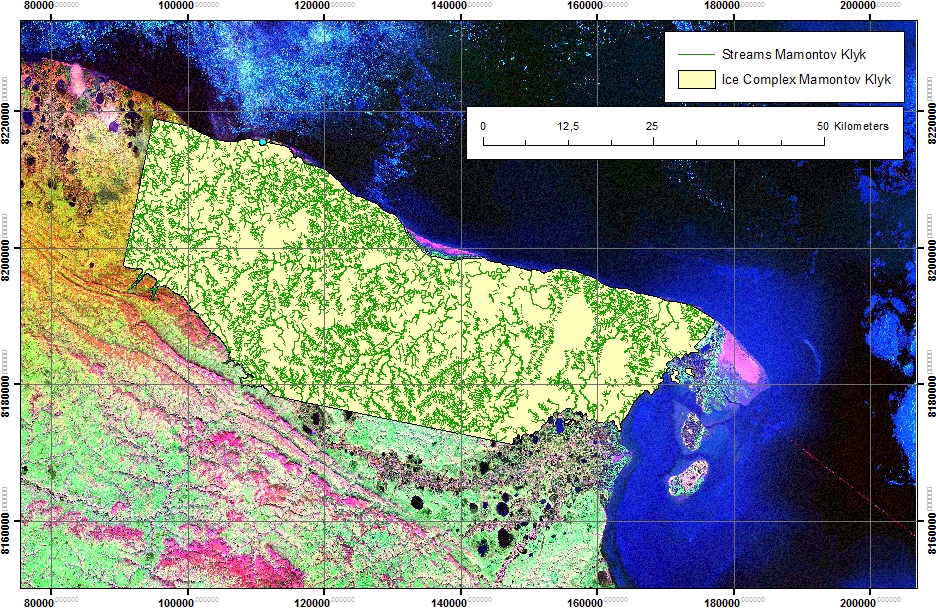
Thermo-erosional valleys and streams in ice-rich permafrost lowlands from Landsat, 2000, Hexagon, 1975, Cape...
The published dataset provides an inventory of thermo-erosional landforms and streams in three lowland areas underlain by ice-rich permafrost of the Yedoma-type Ice Complex at... -
Coastal Retrogressive Thaw Slumps from GeoEye-1, WorldView-2 and Aerial Photographs, 2011, Yukon Coast (CA)
Coastal retrogressive thaw slumps (RTSs) were manually digitized at a 1:2000 scale using ArcMap (ESRI, version 10.3) from high‐resolution satellite images acquired in July (13... -
Remote sensing-based permafrost region disturbances: retrogressive thaw slumps, 1999-2014, Alaska (US)
The data quantify the abundance and distribution of the permafrost region disturbance (PRD) of retrogressive thaw slumps, using trend analyses of 30-m-resolution Landsat imagery... -
Remote sensing-based permafrost region disturbances: retrogressive thaw slumps, 1999-2014, Eastern Siberia (RU)
The data quantify the abundance and distribution of the permafrost region disturbance (PRD) of retrogressive thaw slumps, using trend analyses of 30-m-resolution Landsat imagery... -
Remote sensing-based permafrost region disturbances: retrogressive thaw slumps, 1999-2014, Western Siberia (RU)
The data quantify the abundance and distribution of the permafrost region disturbance (PRD) of retrogressive thaw slumps, using trend analyses of 30-m-resolution Landsat imagery... -
Rockglacier and Slope Instability Inventory from differential SAR interferograms and optical imagery, 1998-2016,...
Rockglaciers and other periglacial processes were mapped using visual analysis of differential SAR interferograms and satellite optical images (Google Satellite, Bing Aerial)... -
Rockglacier and Slope Instability Inventory from differential SAR interferograms and optical imagery, 1998-2016,...
Rockglaciers and other periglacial processes were mapped using visual analysis of differential SAR interferograms and satellite optical images (Google Satellite, Bing Aerial)... -
Rockglacier and Slope Instability Inventory from differential SAR interferograms and optical imagery, 1998-2016,...
Rockglaciers and other periglacial processes were mapped using visual analysis of differential SAR interferograms and satellite optical images (Google Satellite, Bing Aerial)... -
Surface Subsidence Map from Sentinel-1 InSAR, 2016-2018, South Shetland, Antarctica
Surface subsidence was derived from Sentinel-1 synthetic aperture radar time-series with a spatial resolution of 10 m. Maps show the averaged displacement rates during the snow... -
Surface Subsidence Map from Sentinel-1 InSAR, 2016-2018, Yamal, Western Siberia (RU)
Surface subsidence was derived from Sentinel-1 synthetic aperture radar time-series with a spatial resolution of 10 m. Maps show the averaged displacement rates during the snow... -
Surface Subsidence Map from Sentinel-1 InSAR, 2016-2018, Lena Delta, Laptev and East Siberian Sea Region (RU)
Surface subsidence was derived from Sentinel-1 synthetic aperture radar time-series with a spatial resolution of 10 m. Maps show the averaged displacement rates during the snow... -
Surface Subsidence Map from Sentinel-1 InSAR, 2016-2018, Teshekpuk, Alaska (US)
Surface subsidence was derived from Sentinel-1 synthetic aperture radar time-series with a spatial resolution of 5 m. Maps show the averaged displacement rates during the snow... -
Surface Subsidence Map from Sentinel-1 InSAR, 2015-2018, Disko Island, Greenland
Surface subsidence was derived from Sentinel-1 synthetic aperture radar time-series with a spatial resolution of 10 m. Maps show the averaged displacement rates during the snow...


