-
DARTS: Multi-year database of AI detected retrogressive thaw slumps (RTS) and active layer detachment slides (ALD)...
This dataset, called DARTS, comprises footprints of retrogressive thaw slump (RTS) and active layer detachments slides (ALD) identified and quantified using an automated deep...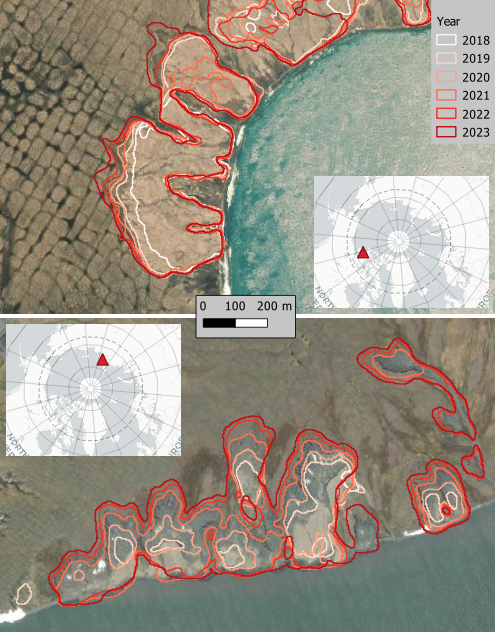
-
Rockglacier and Slope Instability Inventory from differential SAR interferograms and optical imagery, 1998-2016,...
Rockglaciers and other periglacial processes were mapped using visual analysis of differential SAR interferograms and satellite optical images (Google Satellite, Bing Aerial)...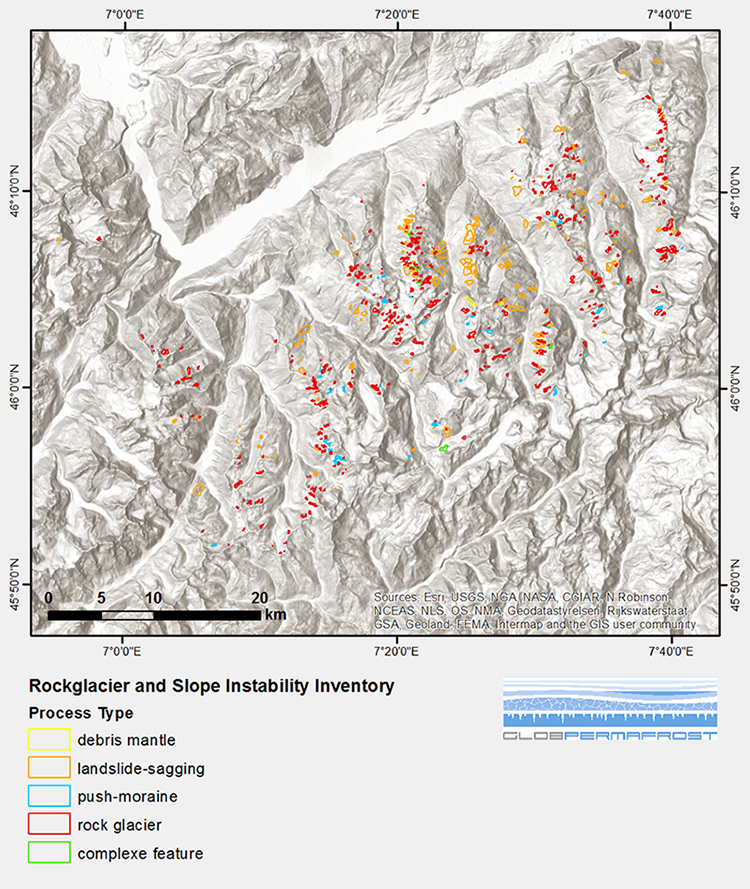
-
Distribution of pingos from topographic maps, permafrost region, Siberia (RU)
A detailed attributed point feature shapefile of 6059 pingo locations in a 3.5 × 10⁶ km² region of northern Asia was manually assembled from 1:200 000 scale Russian...
-
Remote sensing-based permafrost region disturbances: retrogressive thaw slumps, 1999-2014, Alaska (US)
The data quantify the abundance and distribution of the permafrost region disturbance (PRD) of retrogressive thaw slumps, using trend analyses of 30-m-resolution Landsat imagery...
-
Remote sensing-based permafrost region disturbances: retrogressive thaw slumps, 1999-2014, Eastern Siberia (RU)
The data quantify the abundance and distribution of the permafrost region disturbance (PRD) of retrogressive thaw slumps, using trend analyses of 30-m-resolution Landsat imagery...
-
Remote sensing-based permafrost region disturbances: retrogressive thaw slumps, 1999-2014, Western Siberia (RU)
The data quantify the abundance and distribution of the permafrost region disturbance (PRD) of retrogressive thaw slumps, using trend analyses of 30-m-resolution Landsat imagery...
-
Rockglacier and Slope Instability Inventory from differential SAR interferograms and optical imagery, 1998-2016,...
Rockglaciers and other periglacial processes were mapped using visual analysis of differential SAR interferograms and satellite optical images (Google Satellite, Bing Aerial)...
-
Rockglacier and Slope Instability Inventory from differential SAR interferograms and optical imagery, 1998-2016,...
Rockglaciers and other periglacial processes were mapped using visual analysis of differential SAR interferograms and satellite optical images (Google Satellite, Bing Aerial)...
-
Rockglacier and Slope Instability Inventory from differential SAR interferograms and optical imagery, 1998-2016,...
Rockglaciers and other periglacial processes were mapped using visual analysis of differential SAR interferograms and satellite optical images (Google Satellite, Bing Aerial)...