-
Polygonal Tundra Geomorphology Map from Landsat time series, 2014, Alaskan Arctic Coastal Plain (US)
We mosaicked twelve LandSat-8 OLI satellite images taken during the summer of 2014, which were used in an object based image analysis (OBIA) to classify the landscape. We mapped...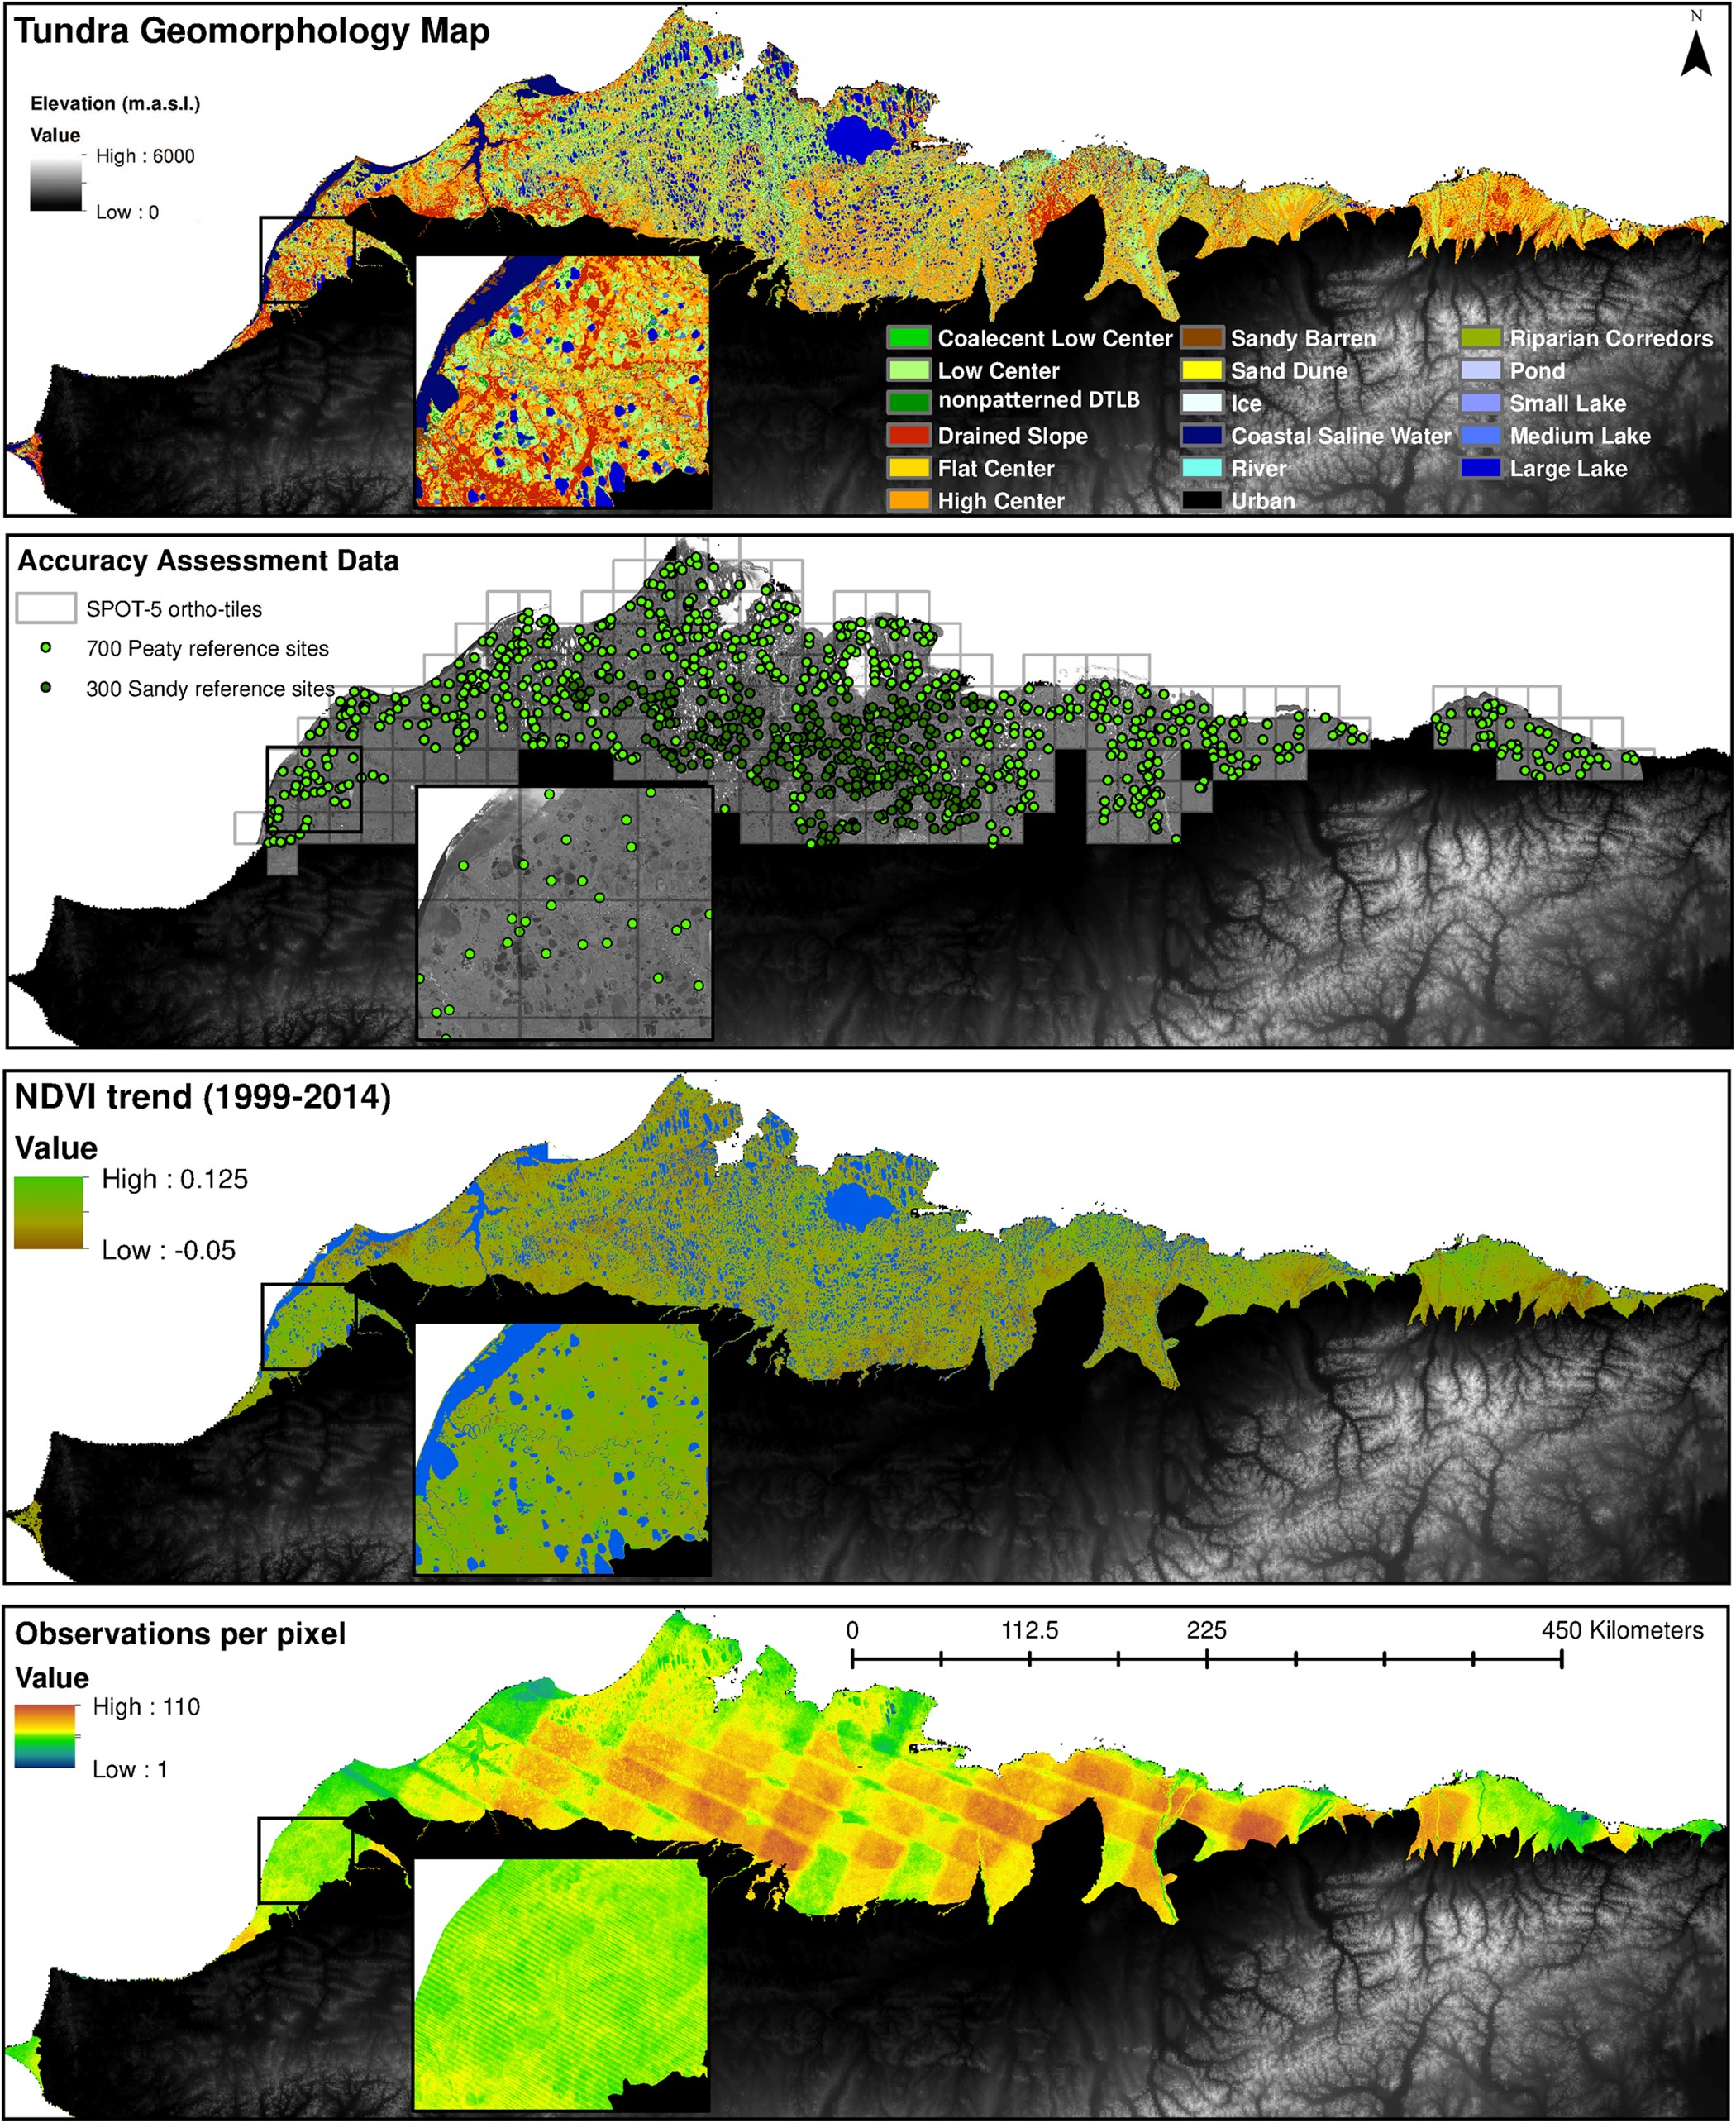
-
NDVI trend from Landsat time series, 1999-2014, Alaskan Arctic Coastal Plain (US)
Normalized difference vegetation index (NDVI) trend map was computed for the Alaskan Arctic Coastal Plain between 1999 and 2014. The decadal trend of each pixel was computed... -
Pan-Arctic Visualization of Landscape Change (2003-2022), Arctic PASSION Permafrost Service
This raster dataset, in Cloud Optimized GeoTIFF format (COG), provides information on land surface changes at the pan-arctic scale. Multispectral Landsat-5 TM, Landsat-7 ETM+,...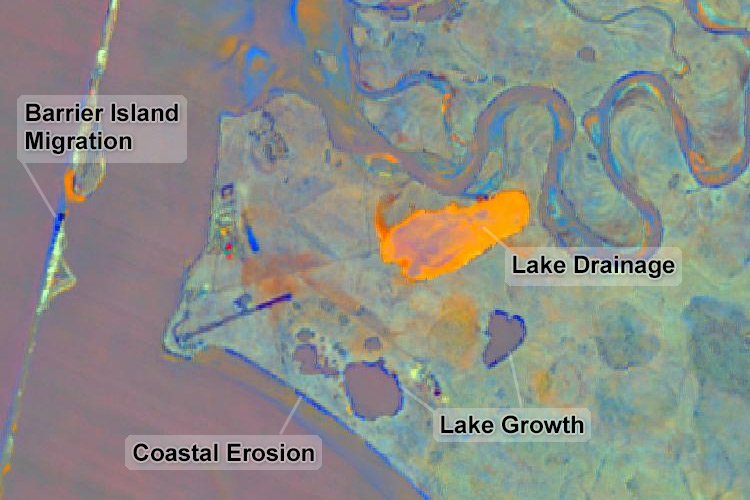
-
Water Body Classification from ENVISAT ASAR Wide Swath, 2007-2011, Lena Delta / East Taymir / Cherskii, Laptev and...
The regional waterbody classification is derived from ENVISAT ASAR Wide Swath data with 150 m resolution. Maps represent the extent of water bodies for the summer months July...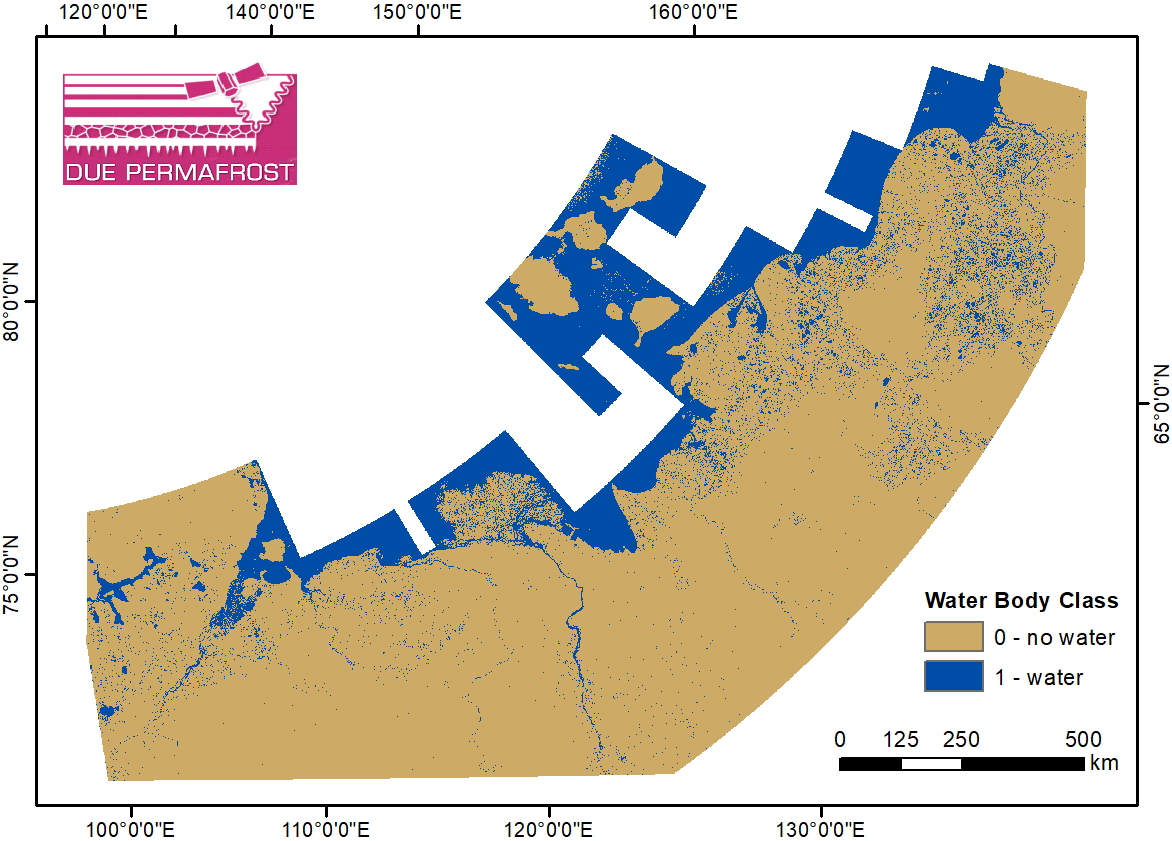
-
Water Body Classification from ENVISAT ASAR Wide Swath, 2007-2011, Ob Estuary and Yamal Peninsula, Western Siberia (RU)
The regional waterbody classification is derived from ENVISAT ASAR Wide Swath data with 150 m resolution. Maps represent the extent of water bodies for the summer months July...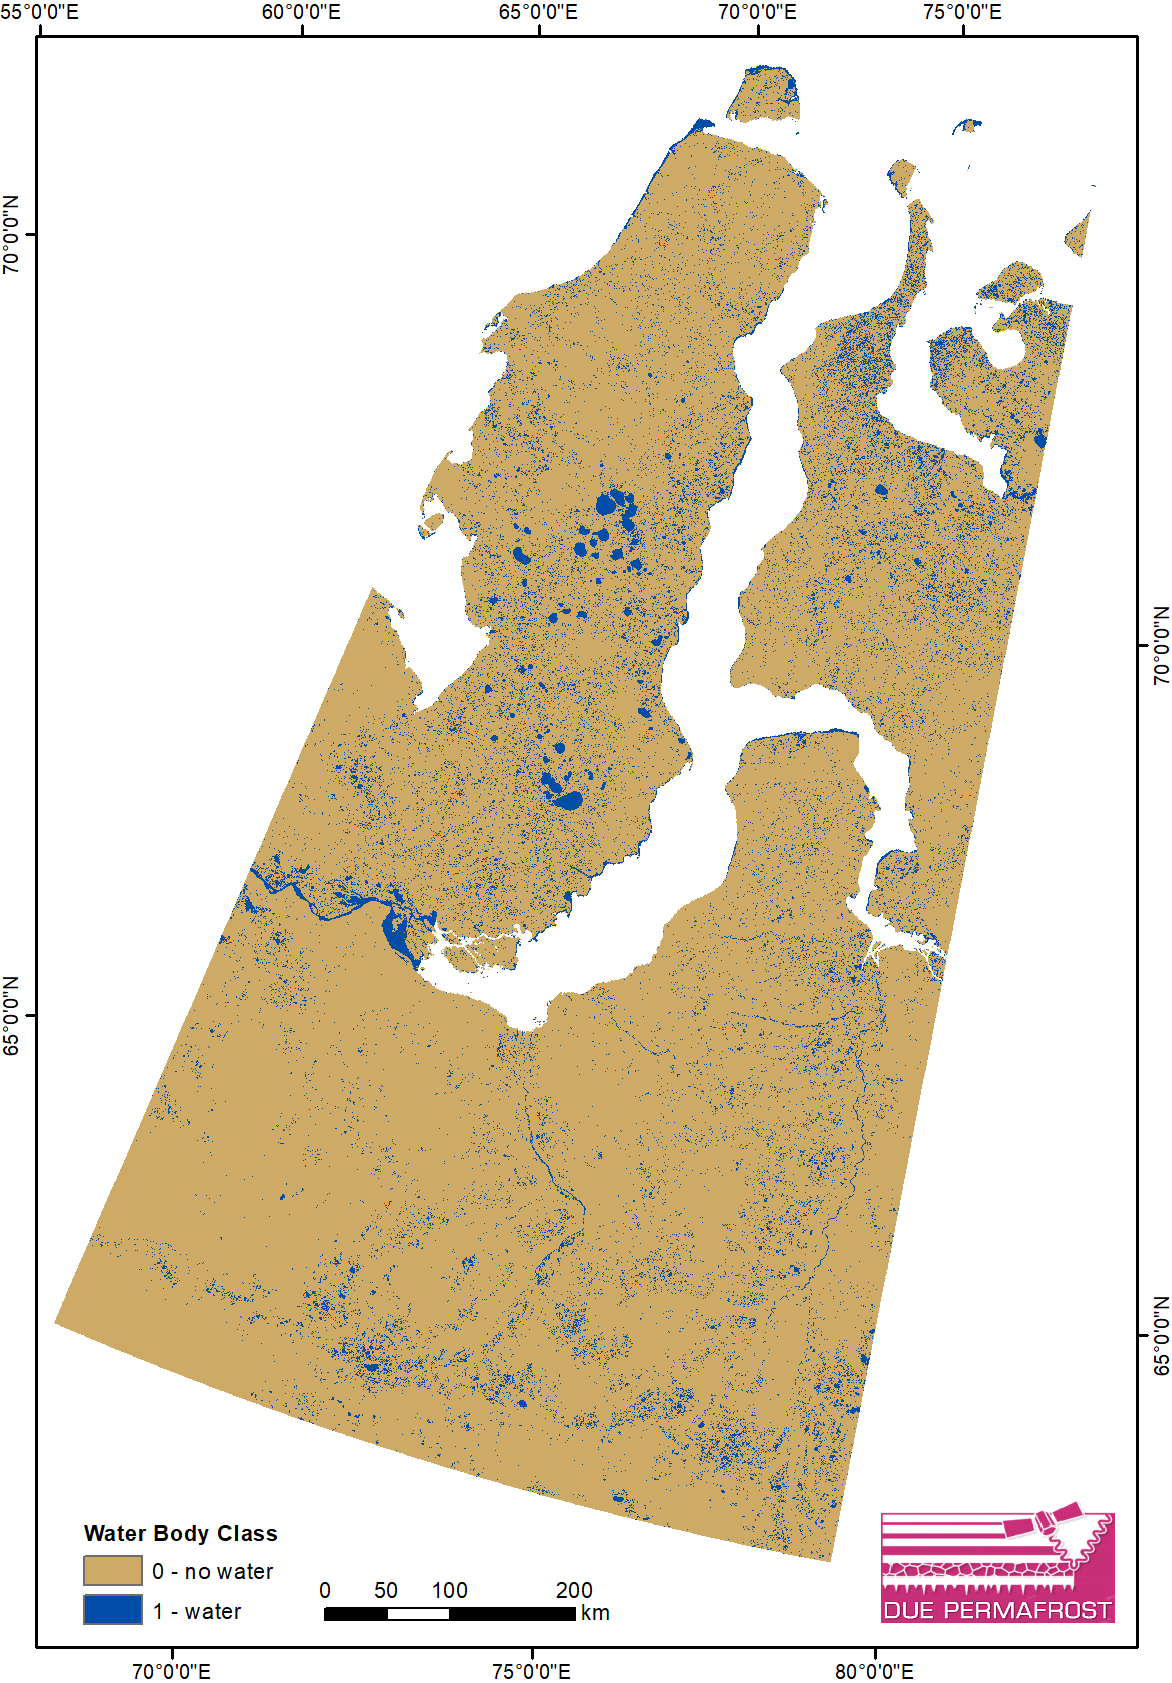
-
Water Body Classification from ENVISAT ASAR Wide Swath, 2007-2008, Yakutsk, Central Yakutia (RU)
The regional waterbody classification is derived from ENVISAT ASAR Wide Swath data with 150 m resolution. Maps represent the extent of water bodies for the summer months July...
-
Water Body Classification from ENVISAT ASAR Wide Swath, 2007-2011, Mackenzie River Valley and Delta, Beaufort Sea Region (CA)
The regional waterbody classification is derived from ENVISAT ASAR Wide Swath data with 150 m resolution. Maps represent the extent of water bodies for the summer months July...
-
Land Cover Classification from Sentinel-1 and Sentinel-2, 2015-2018, Mackenzie Delta, Beaufort Sea Region (CA)
Land cover classes have been derived from bands of Sentinel-2 (bands 3 (green, 10m), 4 (red, 10m), 8 (near infrared, 10m), 11 (SWIR, 20m) and 12 (SWIR, 20m)) as well as...
-
Land Surface Feature Classification from TerraSAR-X, 2013, Lena Delta, Laptev and East Siberian Sea Region (RU)
Land surface features (water, wetland, tundra, and bare surfaces) were classified from TerraSAR-X with a resolution of 5 m for August 2012 and July 2014. The product is based on...
-
Circumarctic wetland dataset based on ENVISAT ASAR Global Monitoring Mode, 2005-2011, Panarctic
A circumpolar representative and consistent wetland map is required for a range of applications ranging from upscaling of carbon fluxes and pools to climate modelling and...
-
Vegetation map of Trail Valley Creek from airborne orthophotos, laser scanning and field work data, Northwest...
The vegetation map distinguishes between five tundra vegetation types, trees, and open water at the forest-tundra transition north of Inuvik, Northwest Territories, Canada. The...
-
A high spatial resolution soil carbon and nitrogen dataset for the northern permafrost region
This spatial dataset is quantifying soil organic carbon (SOC) and total nitrogen (TN) storage with their carbon to nitrogen ratio (C/N) in soils of the northern circumpolar...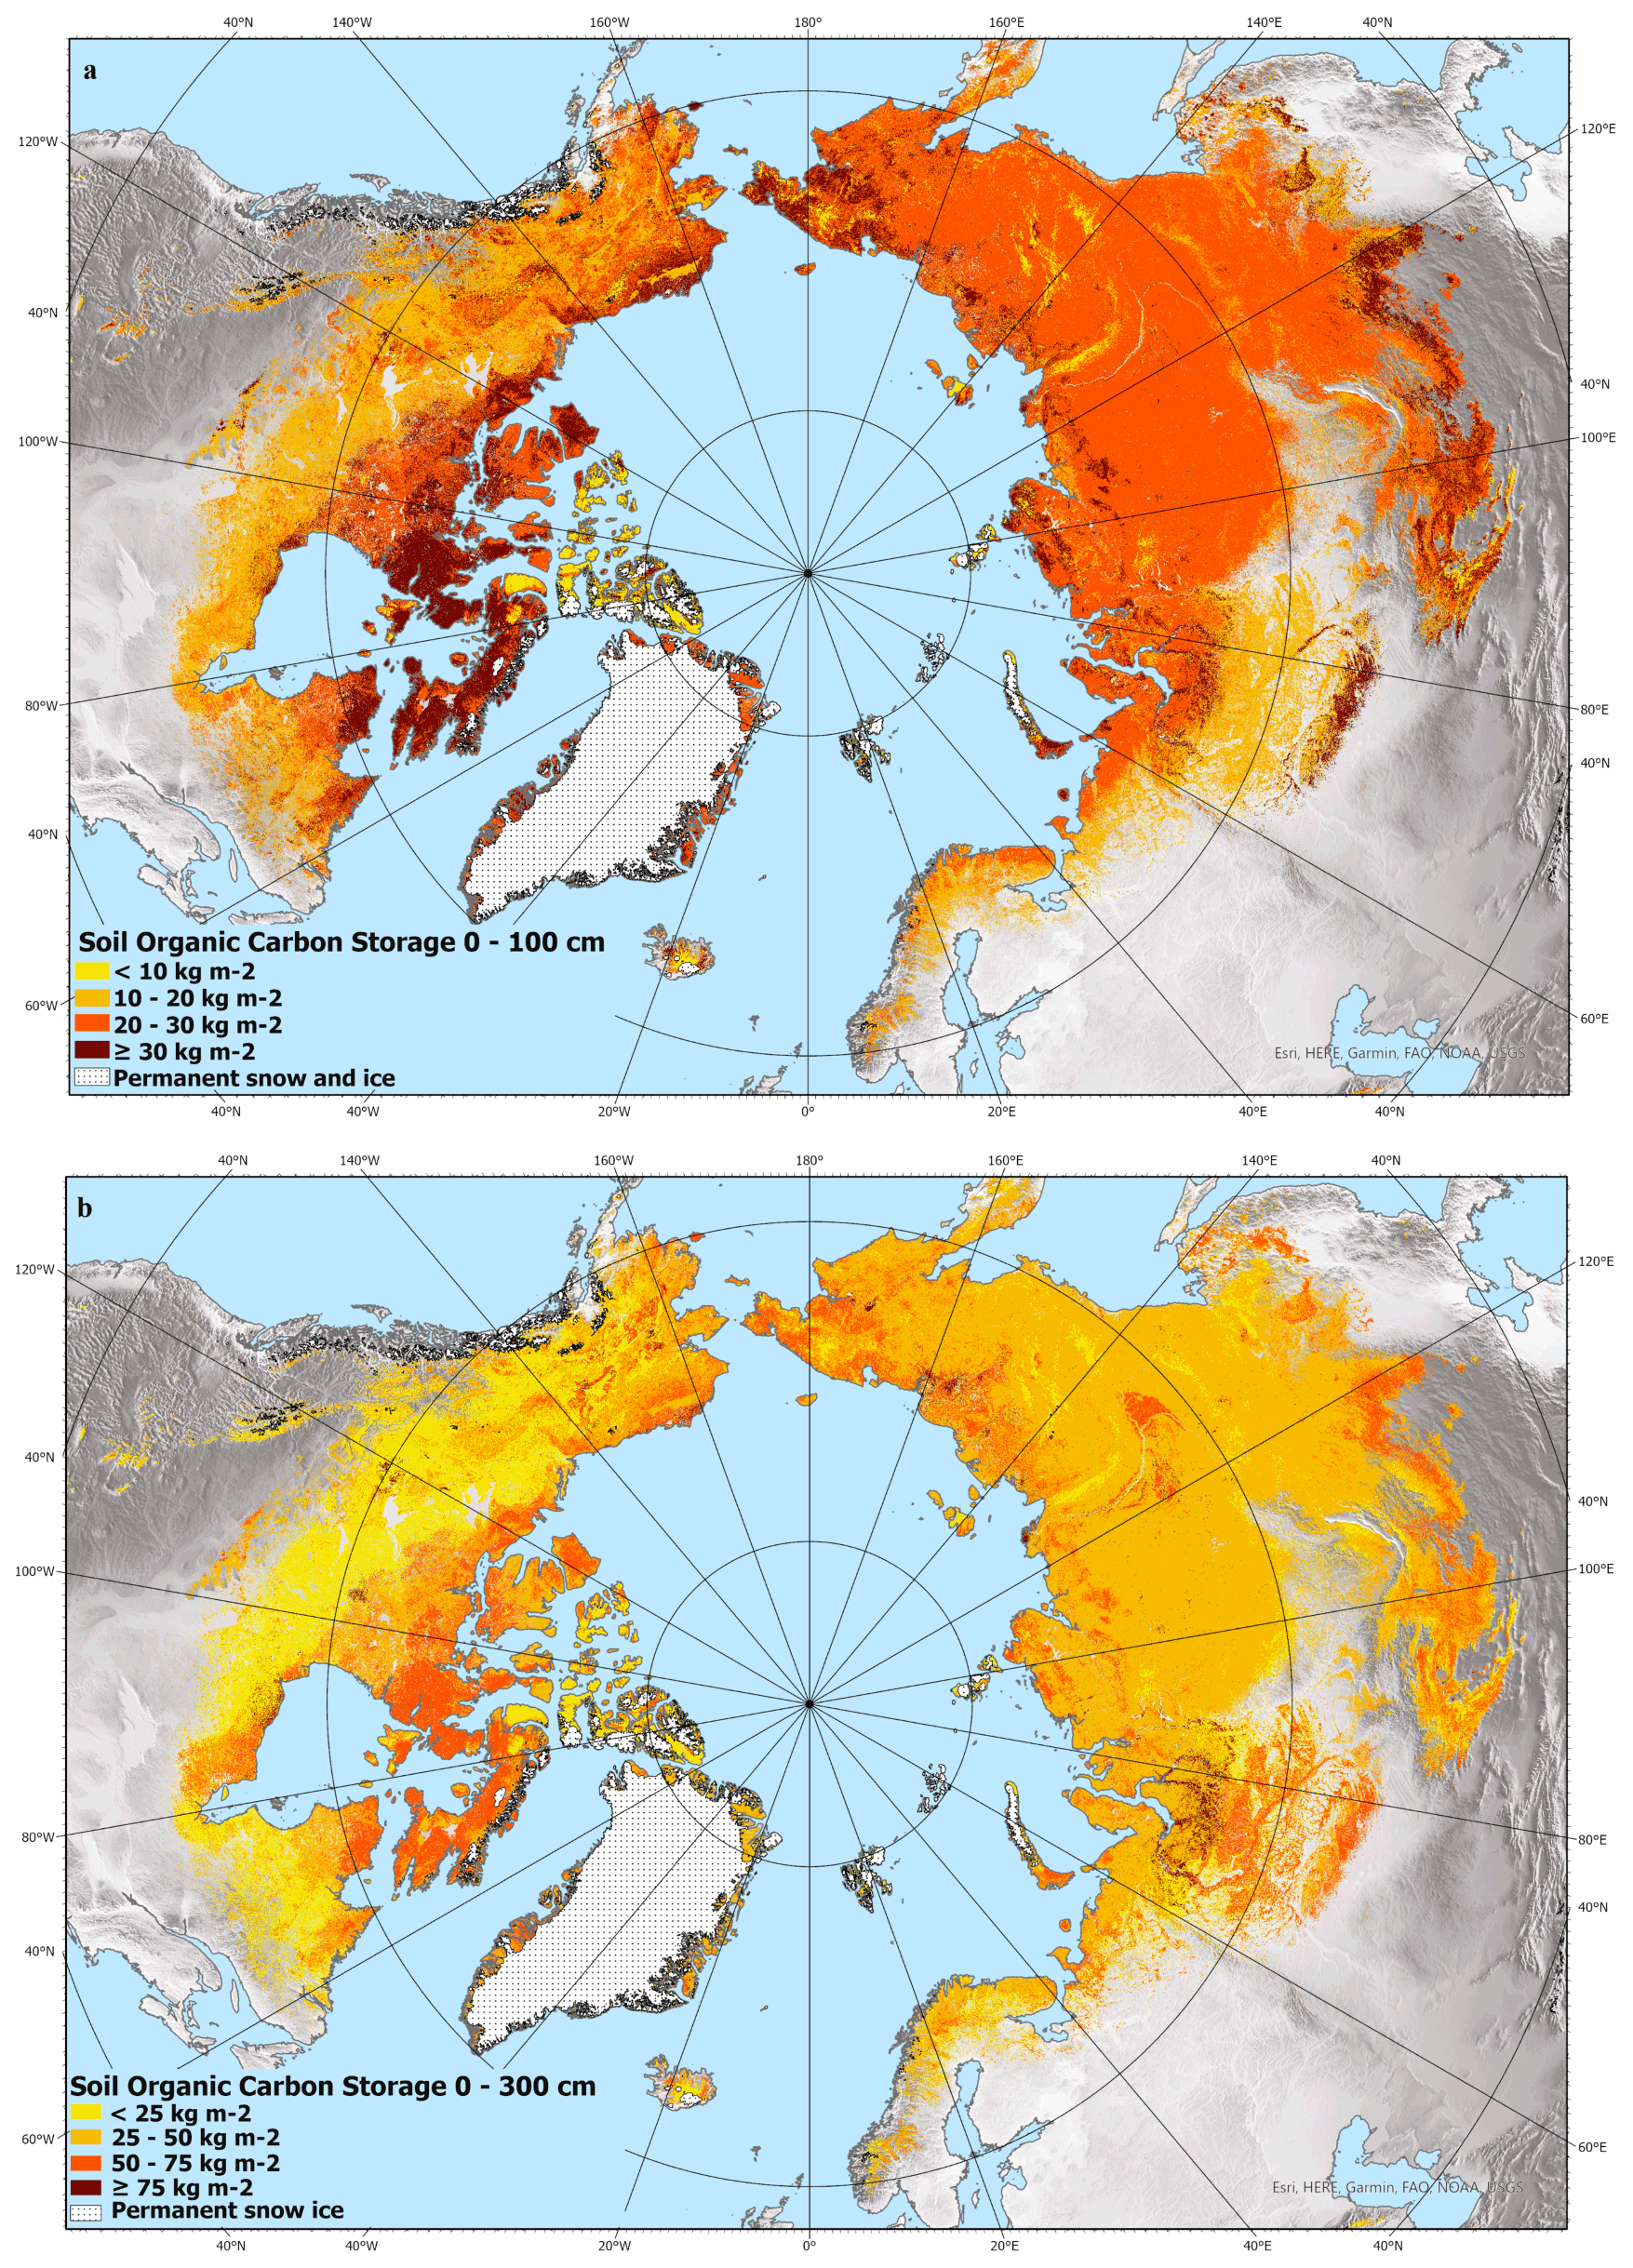
-
Land cover classification of tundra environments from Landsat, 2000-2001, Lena Delta, Laptev Sea Region (RU)
The study was based on land cover classification of three almost cloud free Landsat-7 ETM+ satellite images. The acquisition dates are 27 July 2000 (path 131, rows 8 and 9) and...
-
Raster Circumpolar Arctic Vegetation Map (CAVM) from AVHRR, MODIS and elevation data
Land cover maps are the basic data layer required for understanding and modeling ecological patterns and processes. The Circumpolar Arctic Vegetation Map (CAVM), produced in...
-
Satellite Photo Mosaic from Corona-KH4, 1962-06-28, Northern Seward Peninsula, Alaska (US)
This raster dataset is a high-resolution mosaic of 4 Corona-KH4 satellite photos over the northern Seward Peninsula in Northwest Alaska dated to 28 July 1962. The mosaic covers...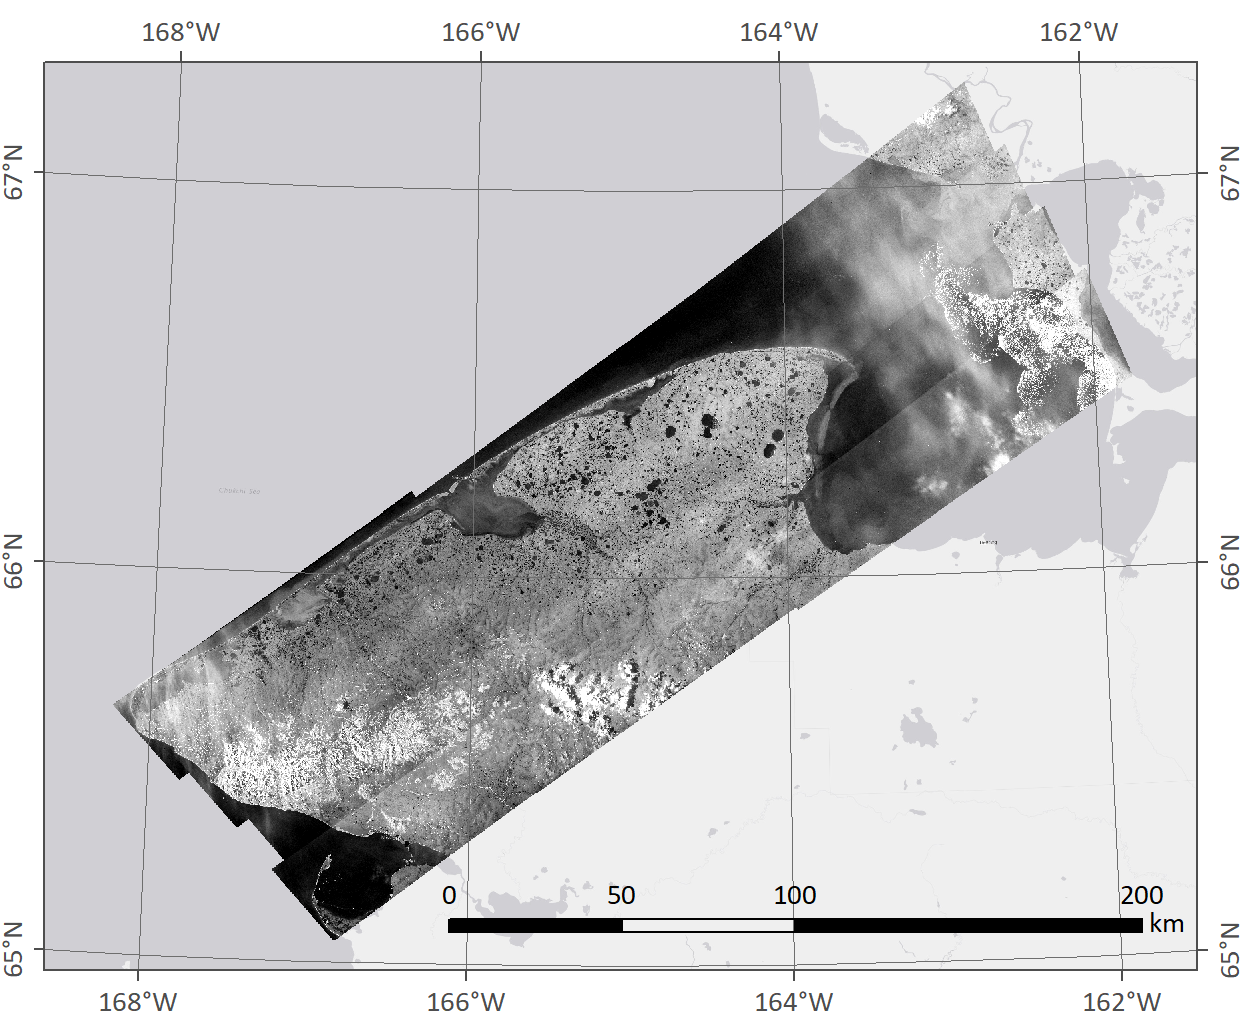
-
Robust trends of landscape dynamics in the Arctic Lena Delta with temporally dense Landsat time-series stacks
The robust Theil-Sen regression algorithm was used to calculate trend parameters (slope, intercept, confidence intervals) on Landsat time-series stack in the north-east Siberian...
-
Lake Ice Classification from Sentinel-1, 2015-2016, Teshekpuk, Alaska (US)
Weekly lake ice classifications distinguish grounded ice and floating ice in lakes based on Sentinel-1A and Sentinel-1B synthetic aperture radar time-series with a resolution of...
-
Vegetation Height from Sentinel-1 and Sentinel-2, Kytalyk, 2016-2018, Central Yakutia (RU)
Vegetation height has been derived from Sentinel-1 satellite data acquired in VV mode with a resolution of 20 m. Vegetation height was estimated using an empirical model on...
-
Lake Ice Classification from Sentinel-1, 2016-2017, Cape Espenberg Lowland, Alaska (US)
Lake ice classifications distinguish grounded ice and floating ice in lakes based on Sentinel-1A and Sentinel-1B synthetic aperture radar time-series with a resolution between...
-
Vegetation Height from Sentinel-1 and Sentinel-2, 2016-2018, Teshekpuk, Arctic Alaska (US)
Vegetation height has been derived from Sentinel-1 satellite data acquired in VV mode with a resolution of 20 m. Vegetation height was estimated using an empirical model on...