-
Rockglacier and Slope Instability Inventory from differential SAR interferograms and optical imagery, 1998-2016,...
Rockglaciers and other periglacial processes were mapped using visual analysis of differential SAR interferograms and satellite optical images (Google Satellite, Bing Aerial)...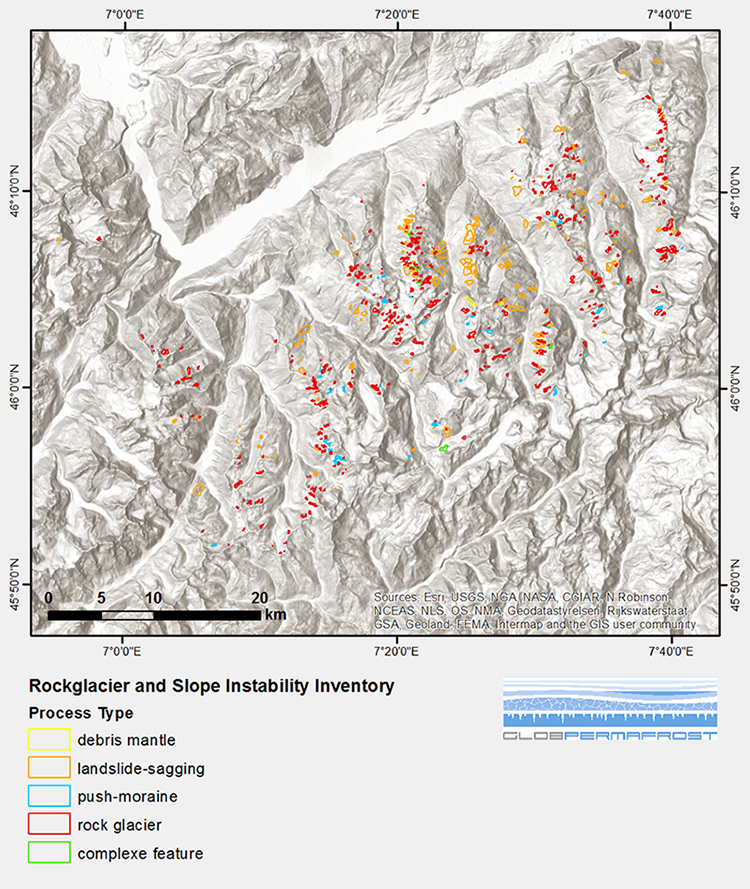
-
Rockglacier and Slope Instability Inventory from differential SAR interferograms and optical imagery, 1998-2016,...
Rockglaciers and other periglacial processes were mapped using visual analysis of differential SAR interferograms and satellite optical images (Google Satellite, Bing Aerial)...
-
Rockglacier and Slope Instability Inventory from differential SAR interferograms and optical imagery, 1998-2016,...
Rockglaciers and other periglacial processes were mapped using visual analysis of differential SAR interferograms and satellite optical images (Google Satellite, Bing Aerial)...
-
Rockglacier and Slope Instability Inventory from differential SAR interferograms and optical imagery, 1998-2016,...
Rockglaciers and other periglacial processes were mapped using visual analysis of differential SAR interferograms and satellite optical images (Google Satellite, Bing Aerial)...
-
Surface Subsidence Map from Sentinel-1 InSAR, 2016-2018, South Shetland, Antarctica
Surface subsidence was derived from Sentinel-1 synthetic aperture radar time-series with a spatial resolution of 10 m. Maps show the averaged displacement rates during the snow...
-
Surface Subsidence Map from Sentinel-1 InSAR, 2016-2018, Yamal, Western Siberia (RU)
Surface subsidence was derived from Sentinel-1 synthetic aperture radar time-series with a spatial resolution of 10 m. Maps show the averaged displacement rates during the snow...
-
Surface Subsidence Map from Sentinel-1 InSAR, 2016-2018, Lena Delta, Laptev and East Siberian Sea Region (RU)
Surface subsidence was derived from Sentinel-1 synthetic aperture radar time-series with a spatial resolution of 10 m. Maps show the averaged displacement rates during the snow...
-
Surface Subsidence Map from Sentinel-1 InSAR, 2016-2018, Teshekpuk, Alaska (US)
Surface subsidence was derived from Sentinel-1 synthetic aperture radar time-series with a spatial resolution of 5 m. Maps show the averaged displacement rates during the snow...
-
Surface Subsidence Map from Sentinel-1 InSAR, 2015-2018, Disko Island, Greenland
Surface subsidence was derived from Sentinel-1 synthetic aperture radar time-series with a spatial resolution of 10 m. Maps show the averaged displacement rates during the snow...