-
Vegetation Height from Sentinel-1 and Sentinel-2, Kytalyk, 2016-2018, Central Yakutia (RU)
Vegetation height has been derived from Sentinel-1 satellite data acquired in VV mode with a resolution of 20 m. Vegetation height was estimated using an empirical model on...
-
Rockglacier and Slope Instability Inventory from differential SAR interferograms and optical imagery, 1998-2016,...
Rockglaciers and other periglacial processes were mapped using visual analysis of differential SAR interferograms and satellite optical images (Google Satellite, Bing Aerial)...
-
Lake Ice Classification from Sentinel-1, 2016-2017, Central Seward Peninsula, Alaska (US)
Lake ice classifications distinguish grounded ice and floating ice in lakes based on Sentinel-1A and Sentinel-1B synthetic aperture radar time-series with a resolution between...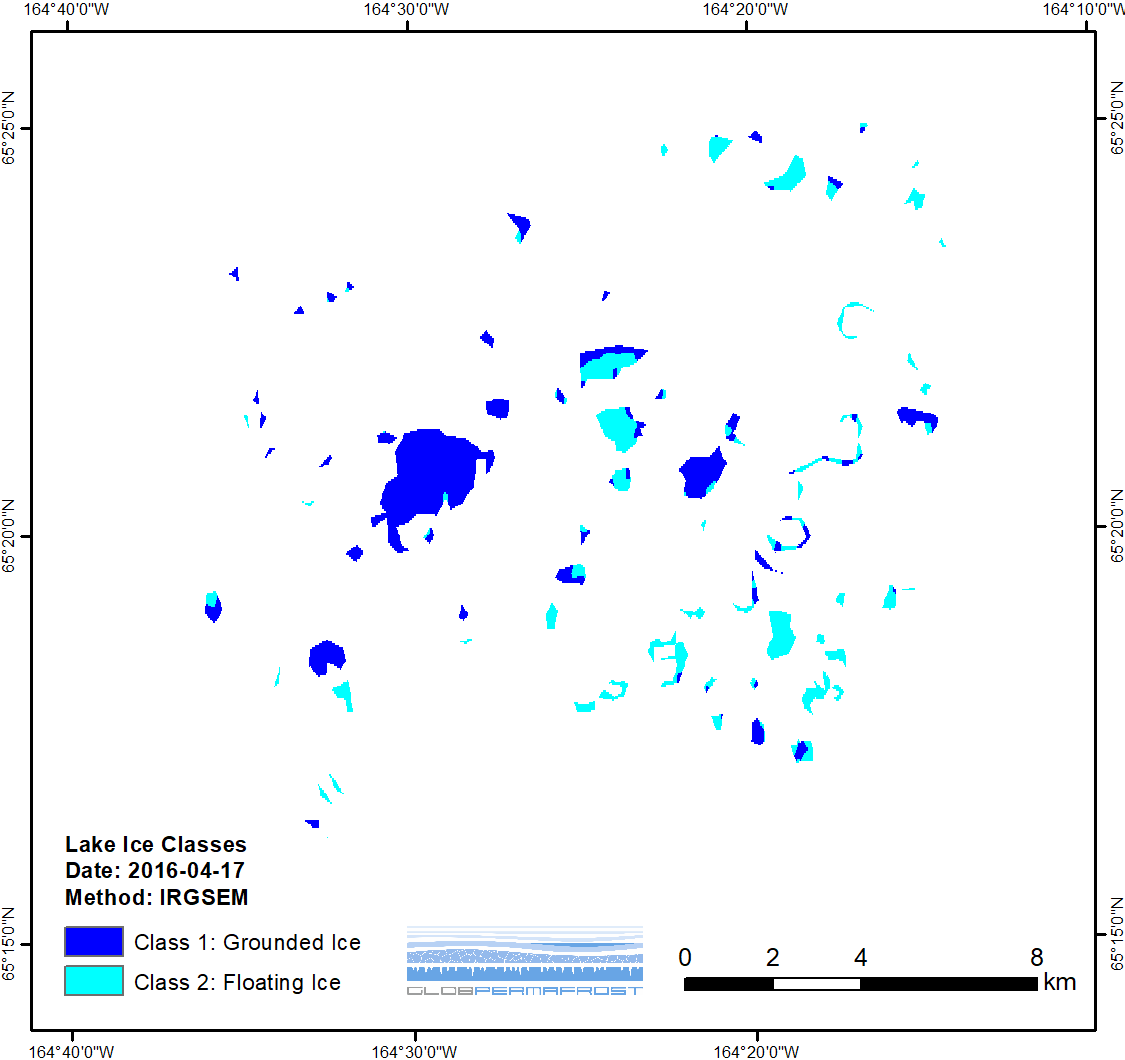
-
Lake Ice Classification from Sentinel-1, 2016-2017, Cape Espenberg Lowland, Alaska (US)
Lake ice classifications distinguish grounded ice and floating ice in lakes based on Sentinel-1A and Sentinel-1B synthetic aperture radar time-series with a resolution between...
-
Vegetation Height from Sentinel-1 and Sentinel-2, 2016-2018, Teshekpuk, Arctic Alaska (US)
Vegetation height has been derived from Sentinel-1 satellite data acquired in VV mode with a resolution of 20 m. Vegetation height was estimated using an empirical model on...
-
Trends of Land Surface Change from Landsat time-series 1999-2014, Eastern Canada, UTM Zone 18N, 62°N - 64°N (CA)
The Hot Spot Regions of Permafrost Change (HRPC) product maps changes in surface characteristics using the full Landsat archive (TM, ETM+, OLI) for the peak summer season (July,...
-
Trends of Land Surface Change from Landsat time-series 1999-2014, Eastern Canada, UTM Zone 18N, 60°N - 62°N (CA)
The Hot Spot Regions of Permafrost Change (HRPC) product maps changes in surface characteristics using the full Landsat archive (TM, ETM+, OLI) for the peak summer season (July,...
-
Trends of Land Surface Change from Landsat time-series 1999-2014, Eastern Canada, UTM Zone 18N, 58°N - 60°N (CA)
The Hot Spot Regions of Permafrost Change (HRPC) product maps changes in surface characteristics using the full Landsat archive (TM, ETM+, OLI) for the peak summer season (July,...
-
Trends of Land Surface Change from Landsat time-series 1999-2014, Eastern Canada, UTM Zone 18N, 56°N - 58°N (CA)
The Hot Spot Regions of Permafrost Change (HRPC) product maps changes in surface characteristics using the full Landsat archive (TM, ETM+, OLI) for the peak summer season (July,...
-
Trends of Land Surface Change from Landsat time-series 1999-2014, Eastern Canada, UTM Zone 18N, 54°N - 56°N (CA)
The Hot Spot Regions of Permafrost Change (HRPC) product maps changes in surface characteristics using the full Landsat archive (TM, ETM+, OLI) for the peak summer season (July,...
-
Trends of Land Surface Change from Landsat time-series 1999-2014, Eastern Canada, UTM Zone 18N, 52°N - 54°N (CA)
The Hot Spot Regions of Permafrost Change (HRPC) product maps changes in surface characteristics using the full Landsat archive (TM, ETM+, OLI) for the peak summer season (July,...
-
Trends of Land Surface Change from Landsat time-series 1999-2014, Eastern Canada, UTM Zone 18N, 50°N - 52°N (CA)
The Hot Spot Regions of Permafrost Change (HRPC) product maps changes in surface characteristics using the full Landsat archive (TM, ETM+, OLI) for the peak summer season (July,...
-
Trends of Land Surface Change from Landsat time-series 1999-2014, Eastern Canada, UTM Zone 17N, 62°N - 64°N (CA)
The Hot Spot Regions of Permafrost Change (HRPC) product maps changes in surface characteristics using the full Landsat archive (TM, ETM+, OLI) for the peak summer season (July,...
-
Trends of Land Surface Change from Landsat time-series 1999-2014, Eastern Canada, UTM Zone 17N, 60°N - 62°N (CA)
The Hot Spot Regions of Permafrost Change (HRPC) product maps changes in surface characteristics using the full Landsat archive (TM, ETM+, OLI) for the peak summer season (July,...
-
Trends of Land Surface Change from Landsat time-series 1999-2014, Eastern Canada, UTM Zone 17N, 58°N - 60°N (CA)
The Hot Spot Regions of Permafrost Change (HRPC) product maps changes in surface characteristics using the full Landsat archive (TM, ETM+, OLI) for the peak summer season (July,...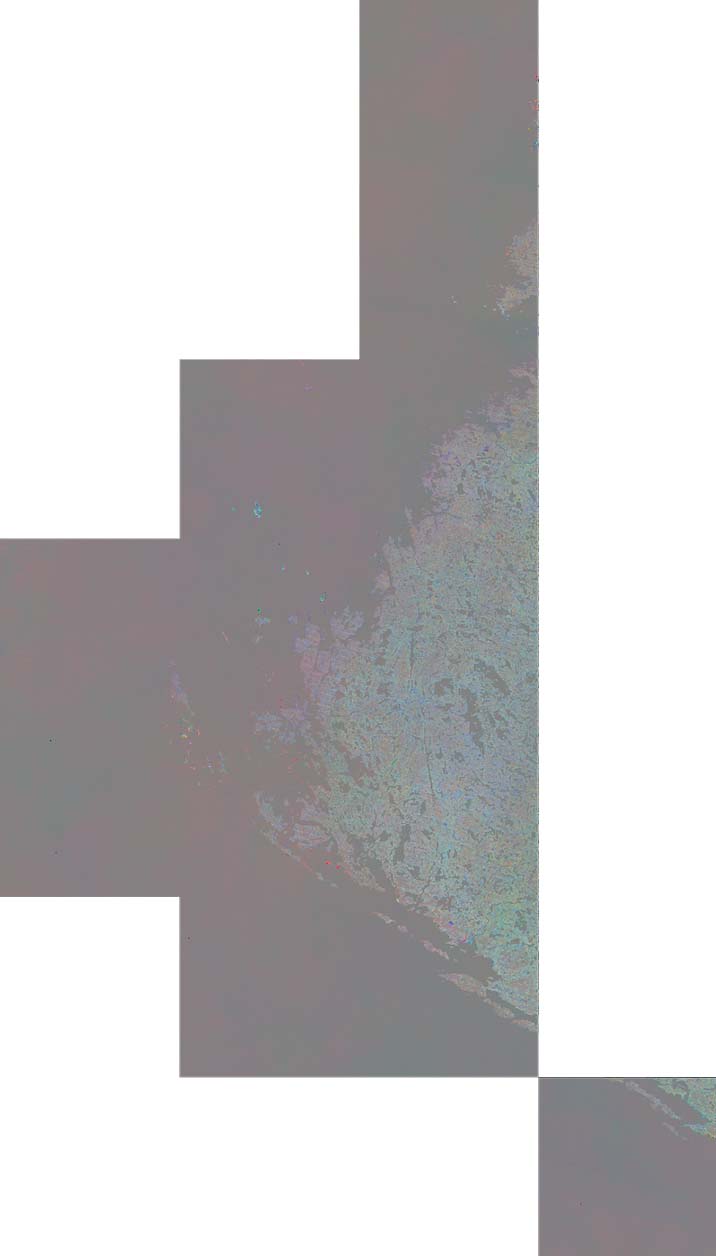
-
Trends of Land Surface Change from Landsat time-series 1999-2014, Eastern Canada, UTM Zone 17N, 56°N - 58°N (CA)
The Hot Spot Regions of Permafrost Change (HRPC) product maps changes in surface characteristics using the full Landsat archive (TM, ETM+, OLI) for the peak summer season (July,...
-
Trends of Land Surface Change from Landsat time-series 1999-2014, Eastern Canada, UTM Zone 17N, 54°N - 56°N (CA)
The Hot Spot Regions of Permafrost Change (HRPC) product maps changes in surface characteristics using the full Landsat archive (TM, ETM+, OLI) for the peak summer season (July,...
-
Trends of Land Surface Change from Landsat time-series 1999-2014, Eastern Canada, UTM Zone 17N, 52°N - 54°N (CA)
The Hot Spot Regions of Permafrost Change (HRPC) product maps changes in surface characteristics using the full Landsat archive (TM, ETM+, OLI) for the peak summer season (July,...
-
Trends of Land Surface Change from Landsat time-series 1999-2014, Eastern Canada, UTM Zone 17N, 50°N - 52°N (CA)
The Hot Spot Regions of Permafrost Change (HRPC) product maps changes in surface characteristics using the full Landsat archive (TM, ETM+, OLI) for the peak summer season (July,...
-
Trends of Land Surface Change from Landsat time-series 1999-2014, Alaska, UTM Zone 6N, 70°N - 72°N (US)
The Hot Spot Regions of Permafrost Change (HRPC) product maps changes in surface characteristics using the full Landsat archive (TM, ETM+, OLI) for the peak summer season (July,...


