-
Super-high-resolution aerial imagery, digital surface model and 3D point cloud of the Selawik Thaw Slump, Alaska
As part of the Perma-X airborne campaign led by the Alfred Wegener Institute in 2021, we collected super-high-resolution multispectral imagery of permafrost landscapes with the...
-
Super-high-resolution aerial imagery, digital surface model and 3D point cloud of the Southern Noatak River, Alaska
As part of the Perma-X airborne campaign led by the Alfred Wegener Institute in 2021, we collected super-high-resolution multispectral imagery of permafrost landscapes with the...
-
Polygonal Tundra Geomorphology Map from Landsat time series, 2014, Alaskan Arctic Coastal Plain (US)
We mosaicked twelve LandSat-8 OLI satellite images taken during the summer of 2014, which were used in an object based image analysis (OBIA) to classify the landscape. We mapped...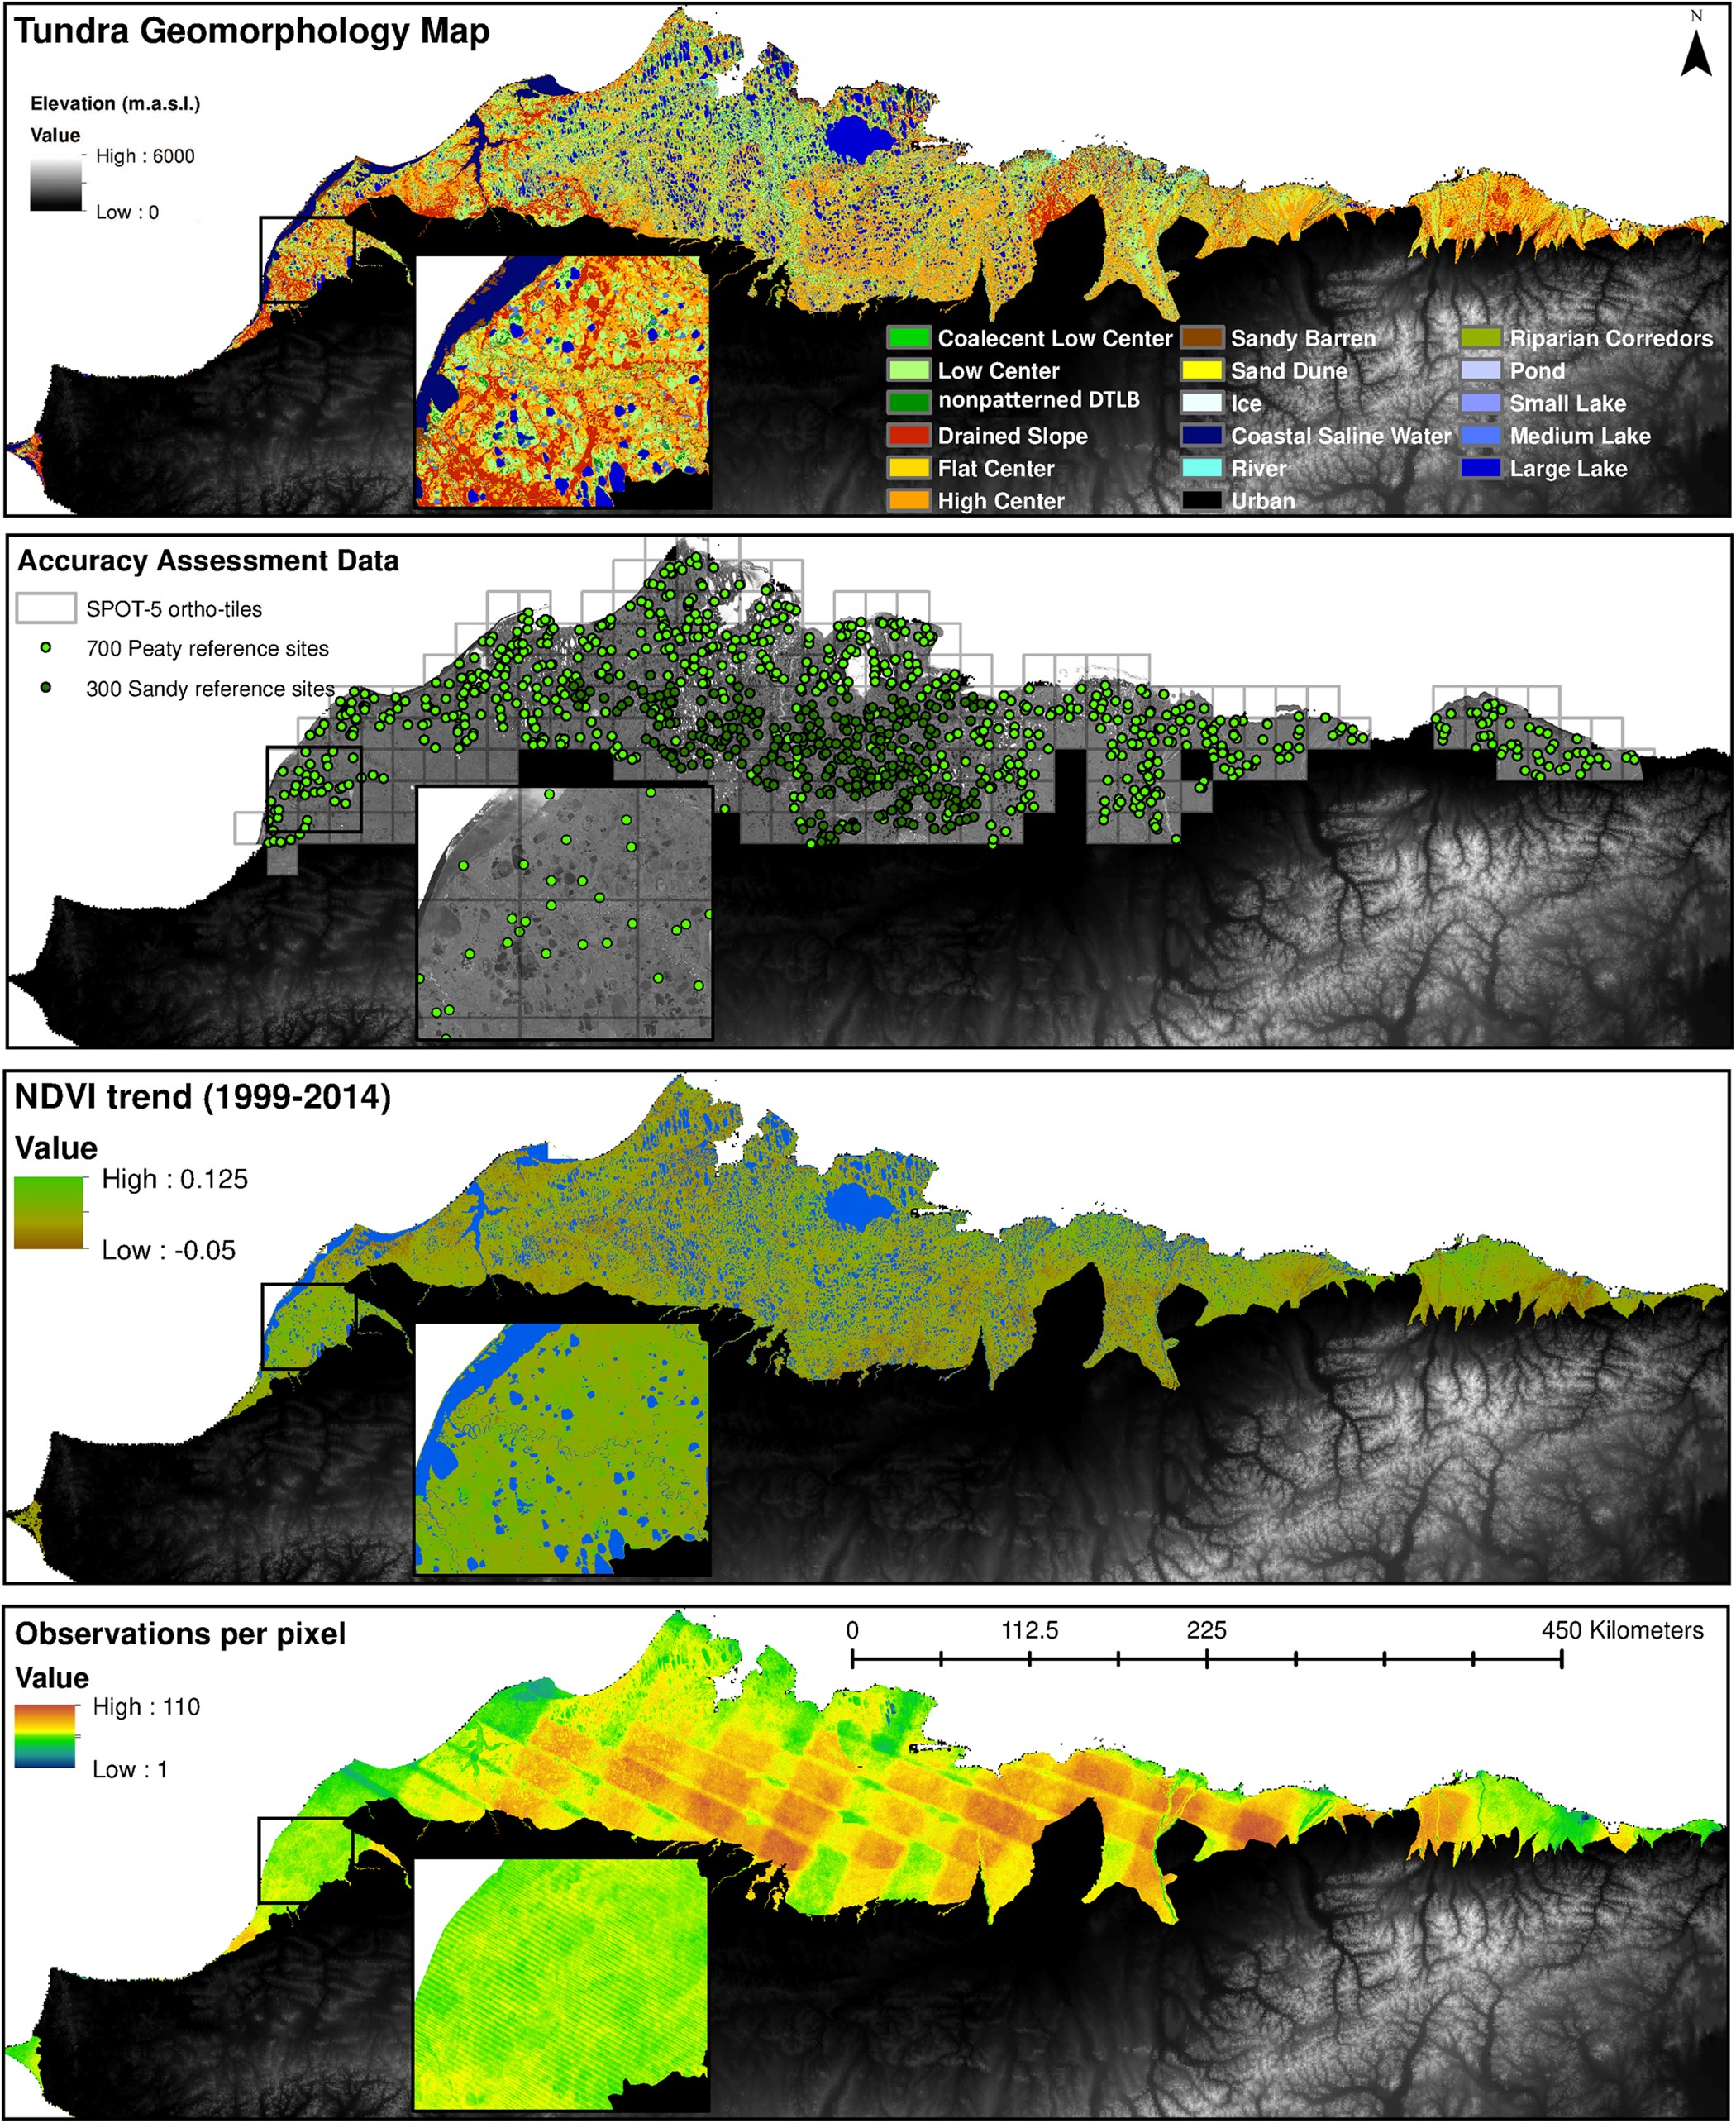
-
NDVI trend from Landsat time series, 1999-2014, Alaskan Arctic Coastal Plain (US)
Normalized difference vegetation index (NDVI) trend map was computed for the Alaskan Arctic Coastal Plain between 1999 and 2014. The decadal trend of each pixel was computed... -
Pan-Arctic Visualization of Landscape Change (2003-2022), Arctic PASSION Permafrost Service
This raster dataset, in Cloud Optimized GeoTIFF format (COG), provides information on land surface changes at the pan-arctic scale. Multispectral Landsat-5 TM, Landsat-7 ETM+,...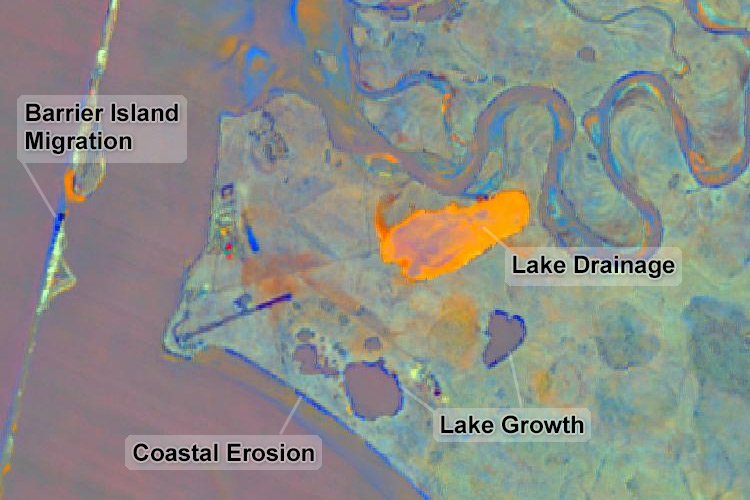
-
Robust trends of landscape dynamics in the Arctic Lena Delta with temporally dense Landsat time-series stacks
The robust Theil-Sen regression algorithm was used to calculate trend parameters (slope, intercept, confidence intervals) on Landsat time-series stack in the north-east Siberian...
-
Trends of Land Surface Change from Landsat time-series 1999-2014, Eastern Canada, UTM Zone 18N, 62°N - 64°N (CA)
The Hot Spot Regions of Permafrost Change (HRPC) product maps changes in surface characteristics using the full Landsat archive (TM, ETM+, OLI) for the peak summer season (July,...
-
Trends of Land Surface Change from Landsat time-series 1999-2014, Eastern Canada, UTM Zone 18N, 60°N - 62°N (CA)
The Hot Spot Regions of Permafrost Change (HRPC) product maps changes in surface characteristics using the full Landsat archive (TM, ETM+, OLI) for the peak summer season (July,...
-
Trends of Land Surface Change from Landsat time-series 1999-2014, Eastern Canada, UTM Zone 18N, 58°N - 60°N (CA)
The Hot Spot Regions of Permafrost Change (HRPC) product maps changes in surface characteristics using the full Landsat archive (TM, ETM+, OLI) for the peak summer season (July,...
-
Trends of Land Surface Change from Landsat time-series 1999-2014, Eastern Canada, UTM Zone 18N, 56°N - 58°N (CA)
The Hot Spot Regions of Permafrost Change (HRPC) product maps changes in surface characteristics using the full Landsat archive (TM, ETM+, OLI) for the peak summer season (July,...
-
Trends of Land Surface Change from Landsat time-series 1999-2014, Eastern Canada, UTM Zone 18N, 54°N - 56°N (CA)
The Hot Spot Regions of Permafrost Change (HRPC) product maps changes in surface characteristics using the full Landsat archive (TM, ETM+, OLI) for the peak summer season (July,...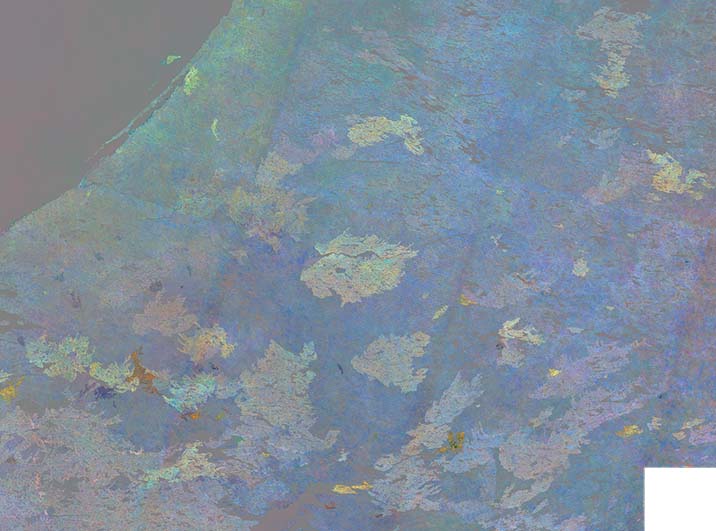
-
Trends of Land Surface Change from Landsat time-series 1999-2014, Eastern Canada, UTM Zone 18N, 52°N - 54°N (CA)
The Hot Spot Regions of Permafrost Change (HRPC) product maps changes in surface characteristics using the full Landsat archive (TM, ETM+, OLI) for the peak summer season (July,...
-
Trends of Land Surface Change from Landsat time-series 1999-2014, Eastern Canada, UTM Zone 18N, 50°N - 52°N (CA)
The Hot Spot Regions of Permafrost Change (HRPC) product maps changes in surface characteristics using the full Landsat archive (TM, ETM+, OLI) for the peak summer season (July,...
-
Trends of Land Surface Change from Landsat time-series 1999-2014, Eastern Canada, UTM Zone 17N, 62°N - 64°N (CA)
The Hot Spot Regions of Permafrost Change (HRPC) product maps changes in surface characteristics using the full Landsat archive (TM, ETM+, OLI) for the peak summer season (July,...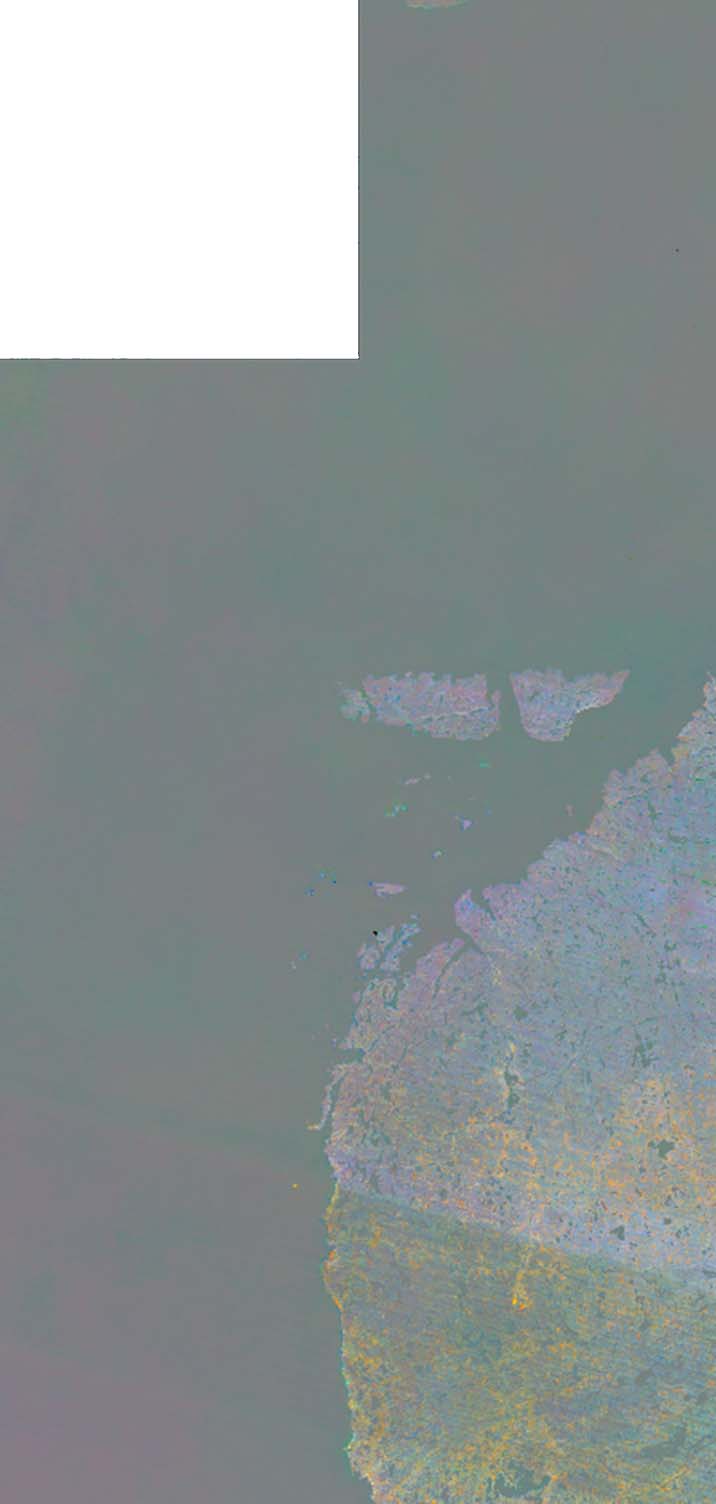
-
Trends of Land Surface Change from Landsat time-series 1999-2014, Eastern Canada, UTM Zone 17N, 60°N - 62°N (CA)
The Hot Spot Regions of Permafrost Change (HRPC) product maps changes in surface characteristics using the full Landsat archive (TM, ETM+, OLI) for the peak summer season (July,...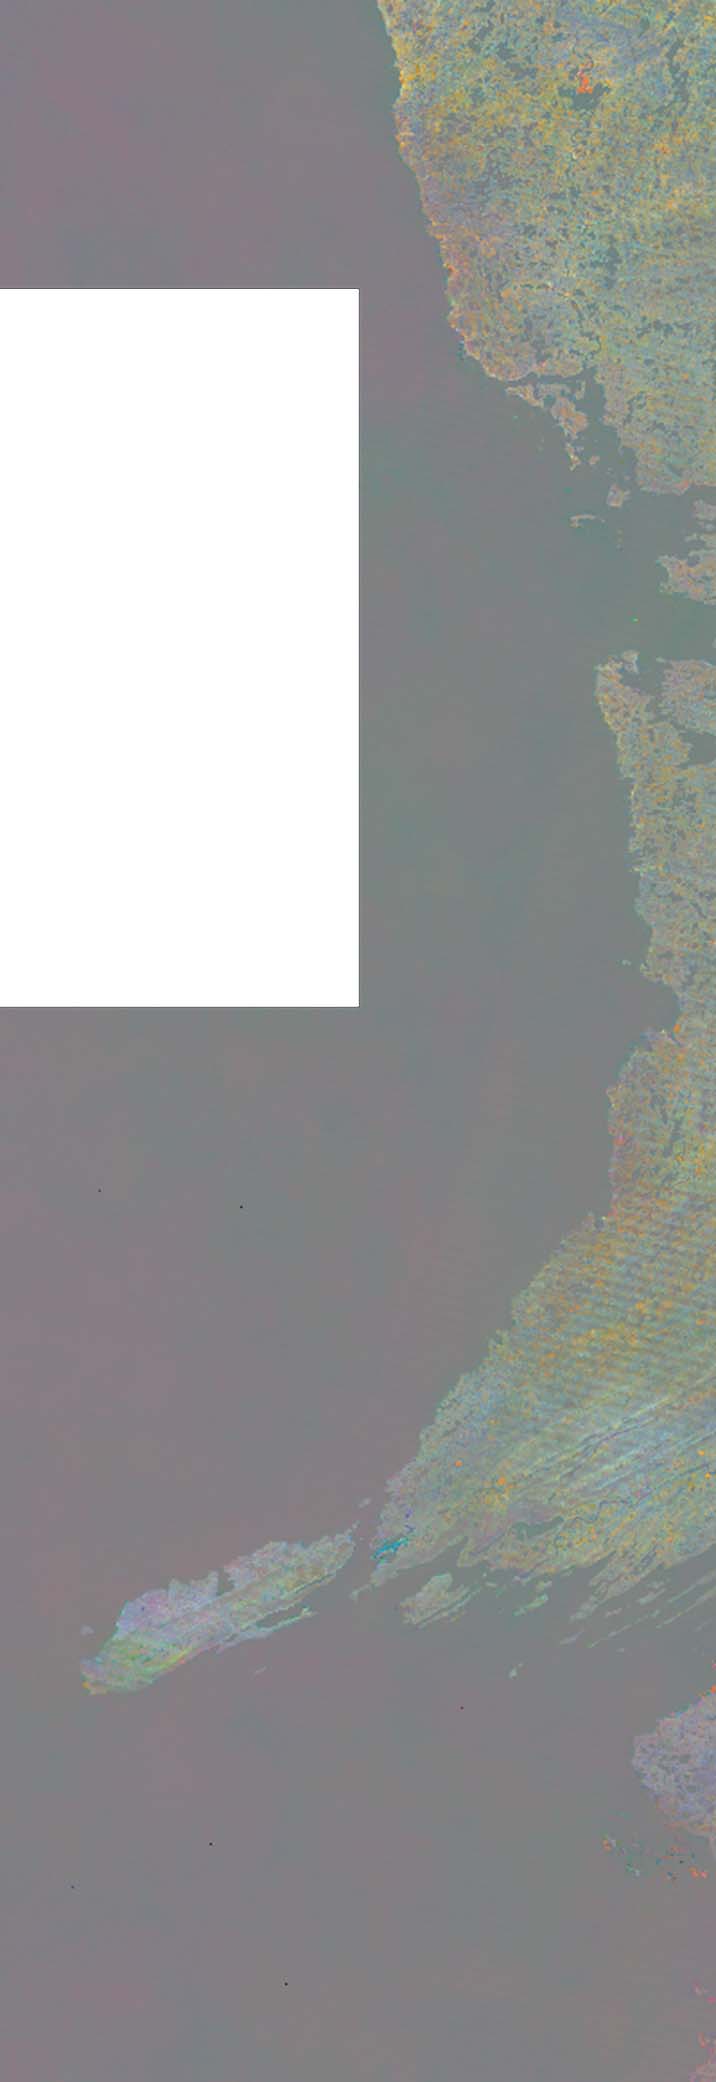
-
Trends of Land Surface Change from Landsat time-series 1999-2014, Eastern Canada, UTM Zone 17N, 58°N - 60°N (CA)
The Hot Spot Regions of Permafrost Change (HRPC) product maps changes in surface characteristics using the full Landsat archive (TM, ETM+, OLI) for the peak summer season (July,...
-
Trends of Land Surface Change from Landsat time-series 1999-2014, Eastern Canada, UTM Zone 17N, 56°N - 58°N (CA)
The Hot Spot Regions of Permafrost Change (HRPC) product maps changes in surface characteristics using the full Landsat archive (TM, ETM+, OLI) for the peak summer season (July,...
-
Trends of Land Surface Change from Landsat time-series 1999-2014, Eastern Canada, UTM Zone 17N, 54°N - 56°N (CA)
The Hot Spot Regions of Permafrost Change (HRPC) product maps changes in surface characteristics using the full Landsat archive (TM, ETM+, OLI) for the peak summer season (July,...
-
Trends of Land Surface Change from Landsat time-series 1999-2014, Eastern Canada, UTM Zone 17N, 52°N - 54°N (CA)
The Hot Spot Regions of Permafrost Change (HRPC) product maps changes in surface characteristics using the full Landsat archive (TM, ETM+, OLI) for the peak summer season (July,...
-
Trends of Land Surface Change from Landsat time-series 1999-2014, Eastern Canada, UTM Zone 17N, 50°N - 52°N (CA)
The Hot Spot Regions of Permafrost Change (HRPC) product maps changes in surface characteristics using the full Landsat archive (TM, ETM+, OLI) for the peak summer season (July,...


