-
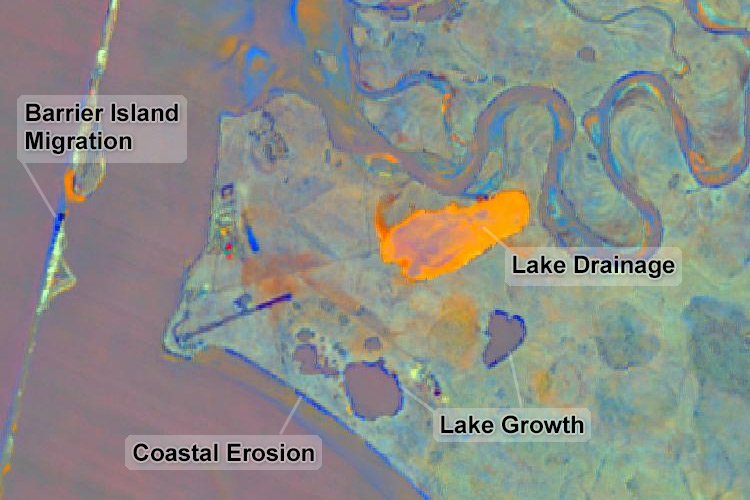
Pan-Arctic Visualization of Landscape Change (2003-2022), Arctic PASSION Permafrost Service
This raster dataset, in Cloud Optimized GeoTIFF format (COG), provides information on land surface changes at the pan-arctic scale. Multispectral Landsat-5 TM, Landsat-7 ETM+,... -
Rockglacier and Slope Instability Inventory from differential SAR interferograms and optical imagery, 1998-2016,...
Rockglaciers and other periglacial processes were mapped using visual analysis of differential SAR interferograms and satellite optical images (Google Satellite, Bing Aerial)... -
Annual dynamics of rapid permafrost disturbances from Landsat and Sentinel-2, 2000-2019, Northeast Siberia (RU)
Permafrost is warming globally which leads to widespread permafrost thaw. Particularly ice-rich permafrost is vulnerable to rapid thaw and erosion, impacting whole landscapes... -
Remote sensing-based permafrost region disturbances: lakes, 1999-2014, Eastern Canada (CA)
The data quantify the abundance and distribution of the permafrost region disturbance (PRD) of lakes and their dynamics, using trend analyses of 30-m-resolution Landsat imagery... -
Remote sensing-based permafrost region disturbances: fire, 1999-2015, Eastern Canada (CA)
The data quantify the abundance and distribution of the permafrost region disturbance (PRD) wildfire, using trend analyses of 30-m-resolution Landsat imagery from 1999-2015 and... -
Remote sensing-based permafrost region disturbances: retrogressive thaw slumps, 1999-2014, Alaska (US)
The data quantify the abundance and distribution of the permafrost region disturbance (PRD) of retrogressive thaw slumps, using trend analyses of 30-m-resolution Landsat imagery... -
Remote sensing-based permafrost region disturbances: lakes, 1999-2014, Alaska (US)
The data quantify the abundance and distribution of the permafrost region disturbance (PRD) of lakes and their dynamics, using trend analyses of 30-m-resolution Landsat imagery... -
Remote sensing-based permafrost region disturbances: fire, 1999-2015, Alaska (US)
The data quantify the abundance and distribution of the permafrost region disturbance (PRD) wildfire, using trend analyses of 30-m-resolution Landsat imagery from 1999-2015 and... -
Remote sensing-based permafrost region disturbances: fire, 1999-2015, Eastern Siberia (RU)
The data quantify the abundance and distribution of the permafrost region disturbance (PRD) wildfire, using trend analyses of 30-m-resolution Landsat imagery from 1999-2015 and... -
Remote sensing-based permafrost region disturbances: lakes, 1999-2014, Eastern Siberia (RU)
The data quantify the abundance and distribution of the permafrost region disturbance (PRD) of lakes and their dynamics, using trend analyses of 30-m-resolution Landsat imagery... -
Remote sensing-based permafrost region disturbances: retrogressive thaw slumps, 1999-2014, Eastern Siberia (RU)
The data quantify the abundance and distribution of the permafrost region disturbance (PRD) of retrogressive thaw slumps, using trend analyses of 30-m-resolution Landsat imagery... -
Remote sensing-based permafrost region disturbances: fire, 1999-2015, Western Siberia (RU)
The data quantify the abundance and distribution of the permafrost region disturbance (PRD) wildfire, using trend analyses of 30-m-resolution Landsat imagery from 1999-2015 and... -
Remote sensing-based permafrost region disturbances: lakes, 1999-2014, Western Siberia (RU)
The data quantify the abundance and distribution of the permafrost region disturbance (PRD) of lakes and their dynamics, using trend analyses of 30-m-resolution Landsat imagery... -
Remote sensing-based permafrost region disturbances: retrogressive thaw slumps, 1999-2014, Western Siberia (RU)
The data quantify the abundance and distribution of the permafrost region disturbance (PRD) of retrogressive thaw slumps, using trend analyses of 30-m-resolution Landsat imagery... -
Rockglacier and Slope Instability Inventory from differential SAR interferograms and optical imagery, 1998-2016,...
Rockglaciers and other periglacial processes were mapped using visual analysis of differential SAR interferograms and satellite optical images (Google Satellite, Bing Aerial)... -
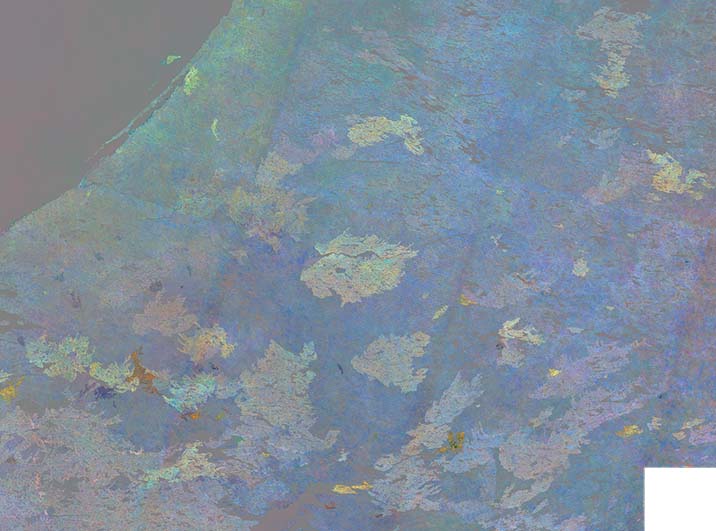
Trends of Land Surface Change from Landsat time-series 1999-2014, Eastern Canada, UTM Zone 18N, 62°N - 64°N (CA)
The Hot Spot Regions of Permafrost Change (HRPC) product maps changes in surface characteristics using the full Landsat archive (TM, ETM+, OLI) for the peak summer season (July,... -
Trends of Land Surface Change from Landsat time-series 1999-2014, Eastern Canada, UTM Zone 18N, 60°N - 62°N (CA)
The Hot Spot Regions of Permafrost Change (HRPC) product maps changes in surface characteristics using the full Landsat archive (TM, ETM+, OLI) for the peak summer season (July,... -
Trends of Land Surface Change from Landsat time-series 1999-2014, Eastern Canada, UTM Zone 18N, 58°N - 60°N (CA)
The Hot Spot Regions of Permafrost Change (HRPC) product maps changes in surface characteristics using the full Landsat archive (TM, ETM+, OLI) for the peak summer season (July,... -
Trends of Land Surface Change from Landsat time-series 1999-2014, Eastern Canada, UTM Zone 18N, 56°N - 58°N (CA)
The Hot Spot Regions of Permafrost Change (HRPC) product maps changes in surface characteristics using the full Landsat archive (TM, ETM+, OLI) for the peak summer season (July,... -
Trends of Land Surface Change from Landsat time-series 1999-2014, Eastern Canada, UTM Zone 18N, 54°N - 56°N (CA)
The Hot Spot Regions of Permafrost Change (HRPC) product maps changes in surface characteristics using the full Landsat archive (TM, ETM+, OLI) for the peak summer season (July,...


