-
Trends of Land Surface Change from Landsat time-series 1999-2014, Western Siberia, UTM Zone 43N, 58°N - 60°N (RU)
The Hot Spot Regions of Permafrost Change (HRPC) product maps changes in surface characteristics using the full Landsat archive (TM, ETM+, OLI) for the peak summer season (July,...
-
Trends of Land Surface Change from Landsat time-series 1999-2014, Western Siberia, UTM Zone 42N, 72°N - 74°N (RU)
The Hot Spot Regions of Permafrost Change (HRPC) product maps changes in surface characteristics using the full Landsat archive (TM, ETM+, OLI) for the peak summer season (July,...
-
Trends of Land Surface Change from Landsat time-series 1999-2014, Western Siberia, UTM Zone 42N, 70°N - 72°N (RU)
The Hot Spot Regions of Permafrost Change (HRPC) product maps changes in surface characteristics using the full Landsat archive (TM, ETM+, OLI) for the peak summer season (July,...
-
Trends of Land Surface Change from Landsat time-series 1999-2014, Western Siberia, UTM Zone 42N, 68°N - 70°N (RU)
The Hot Spot Regions of Permafrost Change (HRPC) product maps changes in surface characteristics using the full Landsat archive (TM, ETM+, OLI) for the peak summer season (July,...
-
Trends of Land Surface Change from Landsat time-series 1999-2014, Western Siberia, UTM Zone 42N, 66°N - 68°N (RU)
The Hot Spot Regions of Permafrost Change (HRPC) product maps changes in surface characteristics using the full Landsat archive (TM, ETM+, OLI) for the peak summer season (July,...
-
Trends of Land Surface Change from Landsat time-series 1999-2014, Western Siberia, UTM Zone 42N, 64°N - 66°N (RU)
The Hot Spot Regions of Permafrost Change (HRPC) product maps changes in surface characteristics using the full Landsat archive (TM, ETM+, OLI) for the peak summer season (July,...
-
Trends of Land Surface Change from Landsat time-series 1999-2014, Western Siberia, UTM Zone 42N, 62°N - 64°N (RU)
The Hot Spot Regions of Permafrost Change (HRPC) product maps changes in surface characteristics using the full Landsat archive (TM, ETM+, OLI) for the peak summer season (July,...
-
Trends of Land Surface Change from Landsat time-series 1999-2014, Western Siberia, UTM Zone 42N, 60°N - 62°N (RU)
The Hot Spot Regions of Permafrost Change (HRPC) product maps changes in surface characteristics using the full Landsat archive (TM, ETM+, OLI) for the peak summer season (July,...
-
Trends of Land Surface Change from Landsat time-series 1999-2014, Western Siberia, UTM Zone 42N, 58°N - 60°N (RU)
The Hot Spot Regions of Permafrost Change (HRPC) product maps changes in surface characteristics using the full Landsat archive (TM, ETM+, OLI) for the peak summer season (July,...
-
Vegetation Height from Sentinel-1 and Sentinel-2, 2015-2018, Seward peninsula, Alaska (US)
Vegetation height has been derived from Sentinel-1 satellite data acquired in VV mode with a resolution of 20 m. Vegetation height was estimated using an empirical model on...
-
Vegetation Height from Sentinel1 and Sentinel-2, 2016-2018, Barrow, Alaska (US)
Vegetation height has been derived from Sentinel-1 satellite data acquired in VV mode with a resolution of 20 m. Vegetation height was estimated using an empirical model on...
-
Vegetation Height from Sentinel-1 and Sentinel-2, 2016-2018, Toolik, Alaska (US)
Vegetation height has been derived from Sentinel-1 satellite data acquired in VV mode with a resolution of 20 m. Vegetation height was estimated using an empirical model on...
-
Vegetation Height from Sentinel-1 and Sentinel-2, 2016-2018, Mackenzie Delta, Beaufort Sea Region (CA)
Vegetation height has been derived from Sentinel-1 satellite data acquired in VV mode with a resolution of 20 m. Vegetation height was estimated using an empirical model on...
-
Vegetation Height from Sentinel-1 and Sentinel-2, 2016-2018, Umiuaq, Quebec-Labrador (CA)
Vegetation height has been derived from Sentinel-1 satellite data acquired in VV mode with a resolution of 20 m. Vegetation height was estimated using an empirical model on...
-
Vegetation Height from Sentinel-1 and Sentinel-2, 2016-2018, Lena Delta, Laptev and East Siberian Sea Region (RU)
Vegetation height has been derived from Sentinel-1 satellite data acquired in VV mode with a resolution of 20 m. Vegetation height was estimated using an empirical model on...
-
Vegetation Height from Sentinel-1 and Sentinel-2, 2016-2018, Western Siberia (RU)
Vegetation height has been derived from Sentinel-1 satellite data acquired in VV mode with a resolution of 20 m. Vegetation height was estimated using an empirical model on...
-
Ground Temperature Map, 2000-2017, Antarctic
The product provides modeled mean annual ground temperatures (MAGT) at the top of the permafrost for Antarctica and Subantarctic islands at 1 km spatial resolution. Permafrost...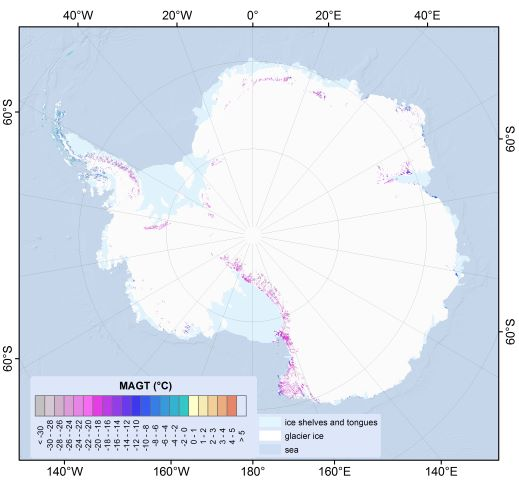
-
Ground Temperature Map, 2000-2016, Andes
The product provides modeled mean annual ground temperatures (MAGT) at the top of the permafrost for Andes at 1 km spatial resolution. Permafrost probability (fraction values...
-
Ground Temperature Map, 2000-2016, East African Plateau
The product provides modeled mean annual ground temperatures (MAGT) at the top of the permafrost for the East African Plateau at 1 km spatial resolution. Permafrost probability...
-
Rockglacier and Slope Instability Inventory from differential SAR interferograms and optical imagery, 1998-2016,...
Rockglaciers and other periglacial processes were mapped using visual analysis of differential SAR interferograms and satellite optical images (Google Satellite, Bing Aerial)...


Šį registrą taip pat galite pasiekti pasinaudodami API (žiūrėkite API dokumentacija).