-
Vegetation map of Trail Valley Creek from airborne orthophotos, laser scanning and field work data, Northwest...
The vegetation map distinguishes between five tundra vegetation types, trees, and open water at the forest-tundra transition north of Inuvik, Northwest Territories, Canada. The...
-
Land cover classification of tundra environments from Landsat, 2000-2001, Lena Delta, Laptev Sea Region (RU)
The study was based on land cover classification of three almost cloud free Landsat-7 ETM+ satellite images. The acquisition dates are 27 July 2000 (path 131, rows 8 and 9) and...
-
Permafrost Region Pond and Lake Database (PeRL)
The Permafrost Region Pond and Lake Database (PeRL) presents the results of a circum-arctic effort to map ponds and lakes from modern (2002-2013) high-resolution aerial and...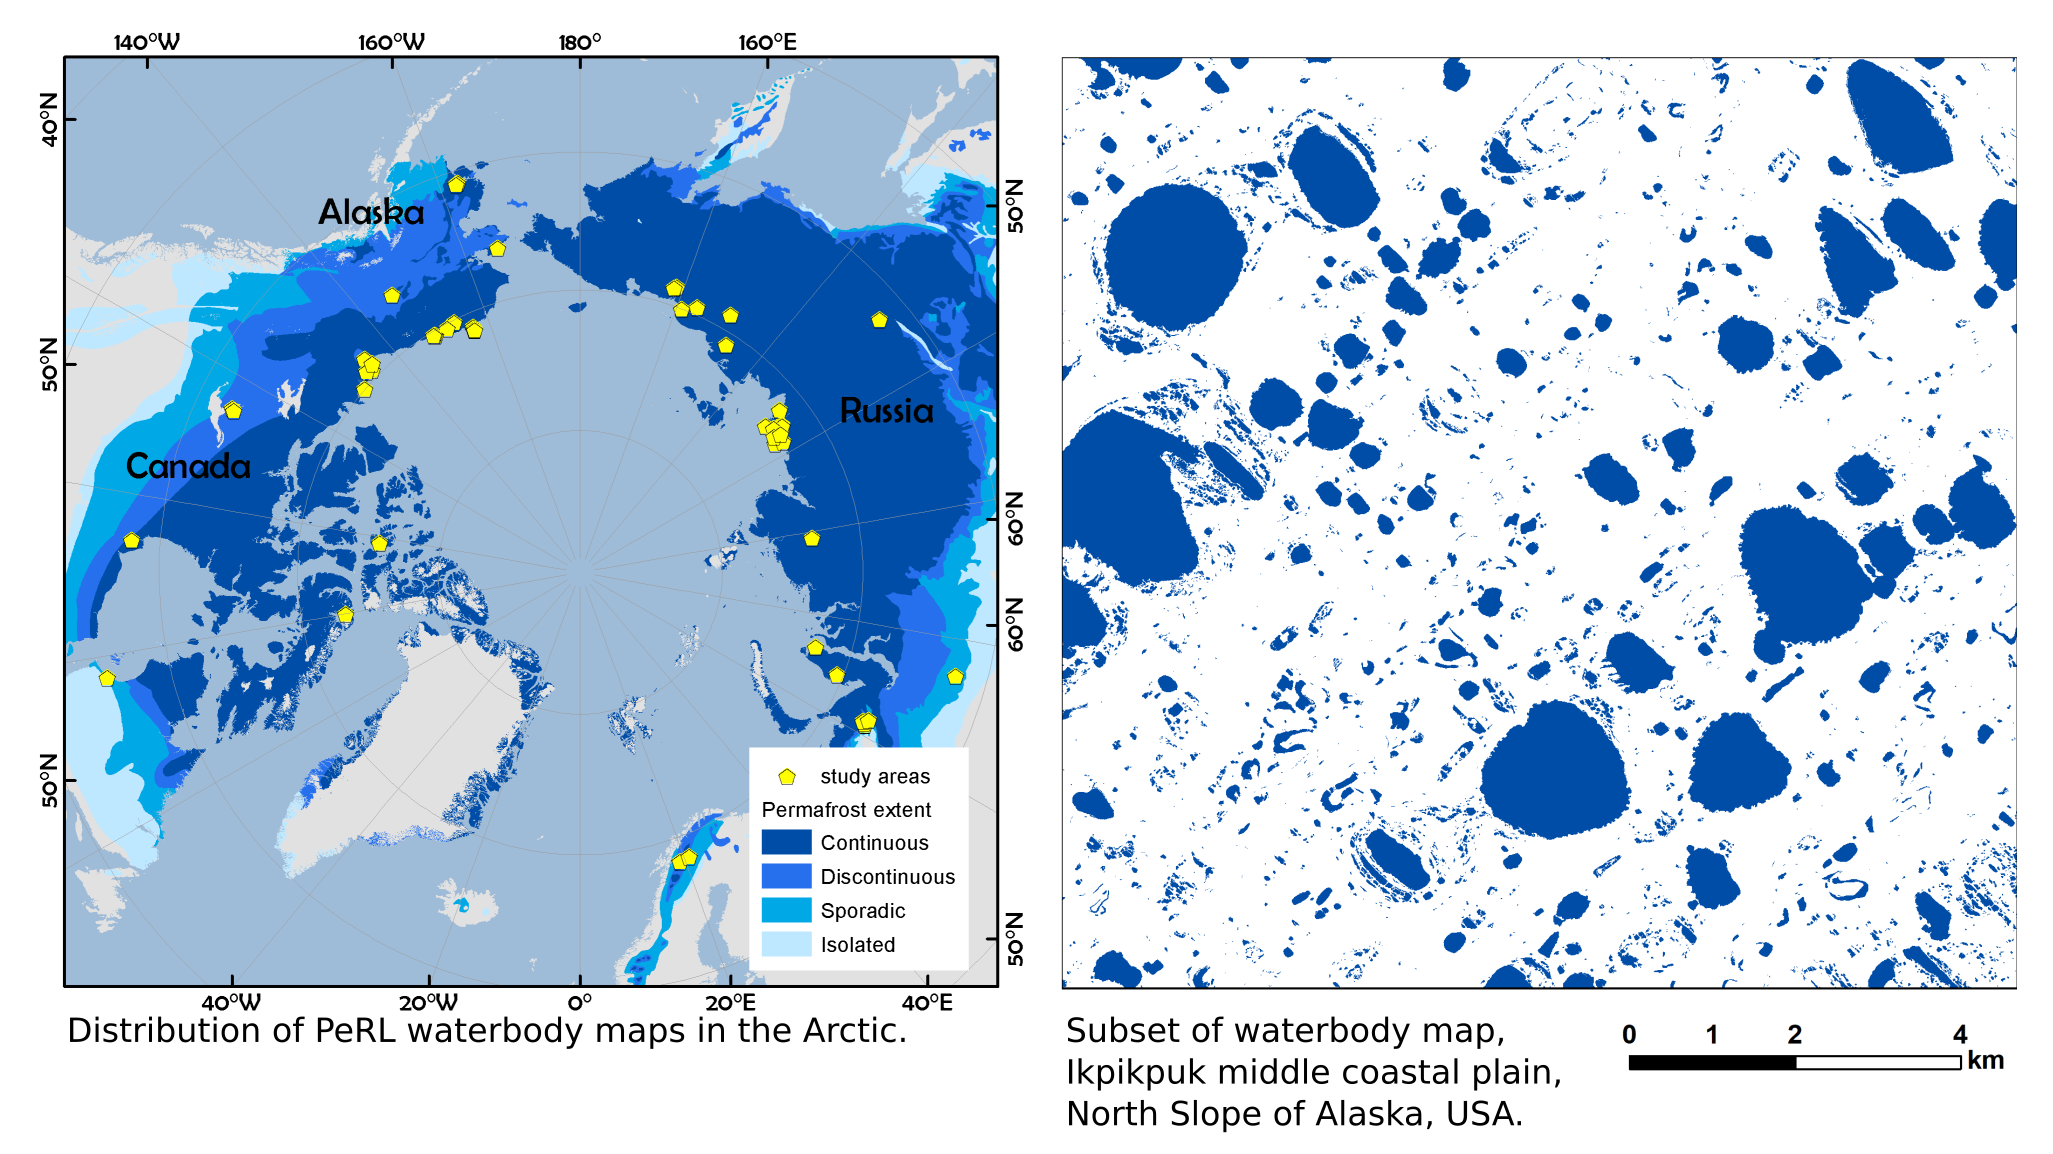
-
Remote sensing-based permafrost region disturbances: lakes, 1999-2014, Eastern Canada (CA)
The data quantify the abundance and distribution of the permafrost region disturbance (PRD) of lakes and their dynamics, using trend analyses of 30-m-resolution Landsat imagery...
-
Remote sensing-based permafrost region disturbances: fire, 1999-2015, Eastern Canada (CA)
The data quantify the abundance and distribution of the permafrost region disturbance (PRD) wildfire, using trend analyses of 30-m-resolution Landsat imagery from 1999-2015 and...
-
Remote sensing-based permafrost region disturbances: retrogressive thaw slumps, 1999-2014, Alaska (US)
The data quantify the abundance and distribution of the permafrost region disturbance (PRD) of retrogressive thaw slumps, using trend analyses of 30-m-resolution Landsat imagery...
-
Remote sensing-based permafrost region disturbances: lakes, 1999-2014, Alaska (US)
The data quantify the abundance and distribution of the permafrost region disturbance (PRD) of lakes and their dynamics, using trend analyses of 30-m-resolution Landsat imagery...
-
Remote sensing-based permafrost region disturbances: fire, 1999-2015, Alaska (US)
The data quantify the abundance and distribution of the permafrost region disturbance (PRD) wildfire, using trend analyses of 30-m-resolution Landsat imagery from 1999-2015 and...
-
Remote sensing-based permafrost region disturbances: fire, 1999-2015, Eastern Siberia (RU)
The data quantify the abundance and distribution of the permafrost region disturbance (PRD) wildfire, using trend analyses of 30-m-resolution Landsat imagery from 1999-2015 and...
-
Remote sensing-based permafrost region disturbances: lakes, 1999-2014, Eastern Siberia (RU)
The data quantify the abundance and distribution of the permafrost region disturbance (PRD) of lakes and their dynamics, using trend analyses of 30-m-resolution Landsat imagery...
-
Remote sensing-based permafrost region disturbances: retrogressive thaw slumps, 1999-2014, Eastern Siberia (RU)
The data quantify the abundance and distribution of the permafrost region disturbance (PRD) of retrogressive thaw slumps, using trend analyses of 30-m-resolution Landsat imagery...
-
Remote sensing-based permafrost region disturbances: fire, 1999-2015, Western Siberia (RU)
The data quantify the abundance and distribution of the permafrost region disturbance (PRD) wildfire, using trend analyses of 30-m-resolution Landsat imagery from 1999-2015 and...
-
Remote sensing-based permafrost region disturbances: lakes, 1999-2014, Western Siberia (RU)
The data quantify the abundance and distribution of the permafrost region disturbance (PRD) of lakes and their dynamics, using trend analyses of 30-m-resolution Landsat imagery...
-
Remote sensing-based permafrost region disturbances: retrogressive thaw slumps, 1999-2014, Western Siberia (RU)
The data quantify the abundance and distribution of the permafrost region disturbance (PRD) of retrogressive thaw slumps, using trend analyses of 30-m-resolution Landsat imagery...
-
Trends of Land Surface Change from Landsat time-series 1999-2014, Eastern Canada, UTM Zone 18N, 62°N - 64°N (CA)
The Hot Spot Regions of Permafrost Change (HRPC) product maps changes in surface characteristics using the full Landsat archive (TM, ETM+, OLI) for the peak summer season (July,...
-
Trends of Land Surface Change from Landsat time-series 1999-2014, Eastern Canada, UTM Zone 18N, 60°N - 62°N (CA)
The Hot Spot Regions of Permafrost Change (HRPC) product maps changes in surface characteristics using the full Landsat archive (TM, ETM+, OLI) for the peak summer season (July,...
-
Trends of Land Surface Change from Landsat time-series 1999-2014, Eastern Canada, UTM Zone 18N, 58°N - 60°N (CA)
The Hot Spot Regions of Permafrost Change (HRPC) product maps changes in surface characteristics using the full Landsat archive (TM, ETM+, OLI) for the peak summer season (July,...
-
Trends of Land Surface Change from Landsat time-series 1999-2014, Eastern Canada, UTM Zone 18N, 56°N - 58°N (CA)
The Hot Spot Regions of Permafrost Change (HRPC) product maps changes in surface characteristics using the full Landsat archive (TM, ETM+, OLI) for the peak summer season (July,...
-
Trends of Land Surface Change from Landsat time-series 1999-2014, Eastern Canada, UTM Zone 18N, 54°N - 56°N (CA)
The Hot Spot Regions of Permafrost Change (HRPC) product maps changes in surface characteristics using the full Landsat archive (TM, ETM+, OLI) for the peak summer season (July,...
-
Trends of Land Surface Change from Landsat time-series 1999-2014, Eastern Canada, UTM Zone 18N, 52°N - 54°N (CA)
The Hot Spot Regions of Permafrost Change (HRPC) product maps changes in surface characteristics using the full Landsat archive (TM, ETM+, OLI) for the peak summer season (July,...


