-
Aufeis (naleds) from 1958 historical maps and 2013-2019 Landsat-8 OLI images, Chukotka region, Siberia (RU)
The GIS database contains the data of aufeis (naled) in the Chukotka region from historical and nowadays sources, and complete ArcGIS 10.1/10.2 and Qgis 3* projects to view and... -
Remote sensing-based permafrost region disturbances: fire, 1999-2015, Eastern Siberia (RU)
The data quantify the abundance and distribution of the permafrost region disturbance (PRD) wildfire, using trend analyses of 30-m-resolution Landsat imagery from 1999-2015 and... -
Remote sensing-based permafrost region disturbances: lakes, 1999-2014, Eastern Siberia (RU)
The data quantify the abundance and distribution of the permafrost region disturbance (PRD) of lakes and their dynamics, using trend analyses of 30-m-resolution Landsat imagery... -
Remote sensing-based permafrost region disturbances: retrogressive thaw slumps, 1999-2014, Eastern Siberia (RU)
The data quantify the abundance and distribution of the permafrost region disturbance (PRD) of retrogressive thaw slumps, using trend analyses of 30-m-resolution Landsat imagery... -
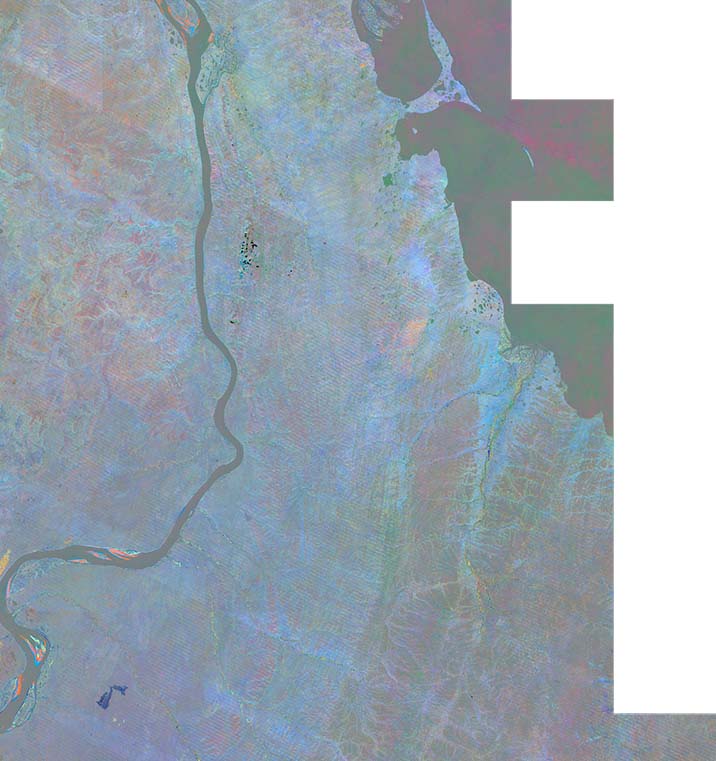
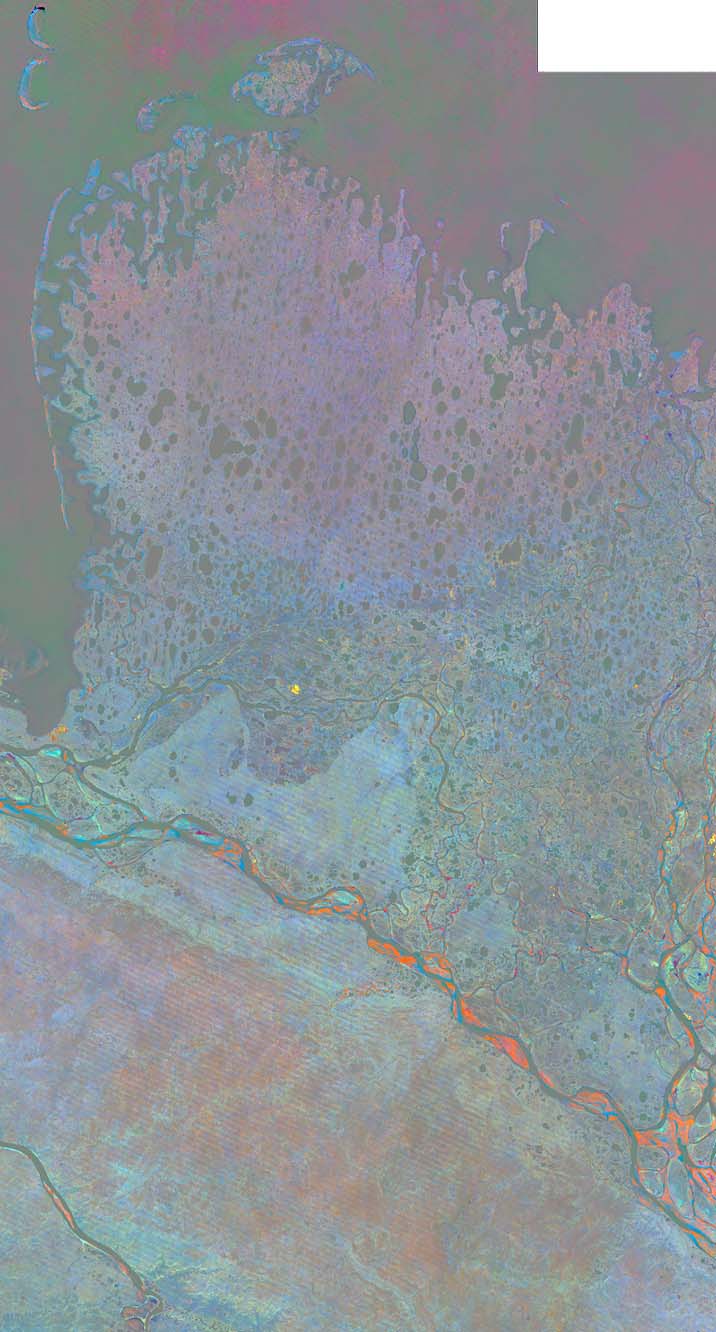
Trends of Land Surface Change from Landsat time-series 1999-2014, Eastern Siberia, UTM Zone 52N, 72°N - 74°N (RU)
The Hot Spot Regions of Permafrost Change (HRPC) product maps changes in surface characteristics using the full Landsat archive (TM, ETM+, OLI) for the peak summer season (July,... -
Trends of Land Surface Change from Landsat time-series 1999-2014, Eastern Siberia, UTM Zone 52N, 70°N - 72°N (RU)
The Hot Spot Regions of Permafrost Change (HRPC) product maps changes in surface characteristics using the full Landsat archive (TM, ETM+, OLI) for the peak summer season (July,... -
Trends of Land Surface Change from Landsat time-series 1999-2014, Eastern Siberia, UTM Zone 52N, 68°N - 70°N (RU)
The Hot Spot Regions of Permafrost Change (HRPC) product maps changes in surface characteristics using the full Landsat archive (TM, ETM+, OLI) for the peak summer season (July,... -
Trends of Land Surface Change from Landsat time-series 1999-2014, Eastern Siberia, UTM Zone 52N, 66°N - 68°N (RU)
The Hot Spot Regions of Permafrost Change (HRPC) product maps changes in surface characteristics using the full Landsat archive (TM, ETM+, OLI) for the peak summer season (July,... -
Trends of Land Surface Change from Landsat time-series 1999-2014, Eastern Siberia, UTM Zone 52N, 64°N - 66°N (RU)
The Hot Spot Regions of Permafrost Change (HRPC) product maps changes in surface characteristics using the full Landsat archive (TM, ETM+, OLI) for the peak summer season (July,... -
Trends of Land Surface Change from Landsat time-series 1999-2014, Eastern Siberia, UTM Zone 52N, 62°N - 64°N (RU)
The Hot Spot Regions of Permafrost Change (HRPC) product maps changes in surface characteristics using the full Landsat archive (TM, ETM+, OLI) for the peak summer season (July,... -
Trends of Land Surface Change from Landsat time-series 1999-2014, Eastern Siberia, UTM Zone 52N, 60°N - 62°N (RU)
The Hot Spot Regions of Permafrost Change (HRPC) product maps changes in surface characteristics using the full Landsat archive (TM, ETM+, OLI) for the peak summer season (July,... -
Trends of Land Surface Change from Landsat time-series 1999-2014, Eastern Siberia, UTM Zone 52N, 58°N - 60°N (RU)
The Hot Spot Regions of Permafrost Change (HRPC) product maps changes in surface characteristics using the full Landsat archive (TM, ETM+, OLI) for the peak summer season (July,... -
Trends of Land Surface Change from Landsat time-series 1999-2014, Eastern Siberia, UTM Zone 51N, 72°N - 74°N (RU)
The Hot Spot Regions of Permafrost Change (HRPC) product maps changes in surface characteristics using the full Landsat archive (TM, ETM+, OLI) for the peak summer season (July,... -
Trends of Land Surface Change from Landsat time-series 1999-2014, Eastern Siberia, UTM Zone 51N, 70°N - 72°N (RU)
The Hot Spot Regions of Permafrost Change (HRPC) product maps changes in surface characteristics using the full Landsat archive (TM, ETM+, OLI) for the peak summer season (July,... -
Trends of Land Surface Change from Landsat time-series 1999-2014, Eastern Siberia, UTM Zone 51N, 68°N - 70°N (RU)
The Hot Spot Regions of Permafrost Change (HRPC) product maps changes in surface characteristics using the full Landsat archive (TM, ETM+, OLI) for the peak summer season (July,... -
Trends of Land Surface Change from Landsat time-series 1999-2014, Eastern Siberia, UTM Zone 51N, 66°N - 68°N (RU)
The Hot Spot Regions of Permafrost Change (HRPC) product maps changes in surface characteristics using the full Landsat archive (TM, ETM+, OLI) for the peak summer season (July,... -
Trends of Land Surface Change from Landsat time-series 1999-2014, Eastern Siberia, UTM Zone 51N, 64°N - 66°N (RU)
The Hot Spot Regions of Permafrost Change (HRPC) product maps changes in surface characteristics using the full Landsat archive (TM, ETM+, OLI) for the peak summer season (July,... -
Trends of Land Surface Change from Landsat time-series 1999-2014, Eastern Siberia, UTM Zone 51N, 62°N - 64°N (RU)
The Hot Spot Regions of Permafrost Change (HRPC) product maps changes in surface characteristics using the full Landsat archive (TM, ETM+, OLI) for the peak summer season (July,... -
Trends of Land Surface Change from Landsat time-series 1999-2014, Eastern Siberia, UTM Zone 51N, 60°N - 62°N (RU)
The Hot Spot Regions of Permafrost Change (HRPC) product maps changes in surface characteristics using the full Landsat archive (TM, ETM+, OLI) for the peak summer season (July,... -
Trends of Land Surface Change from Landsat time-series 1999-2014, Eastern Siberia, UTM Zone 51N, 58°N - 60°N (RU)
The Hot Spot Regions of Permafrost Change (HRPC) product maps changes in surface characteristics using the full Landsat archive (TM, ETM+, OLI) for the peak summer season (July,...


