-
Rockglacier and Slope Instability Inventory from differential SAR interferograms and optical imagery, 1998-2016, West...
Rockglaciers and other periglacial processes were mapped using visual analysis of differential SAR interferograms and satellite optical images (Google Satellite, Bing Aerial)...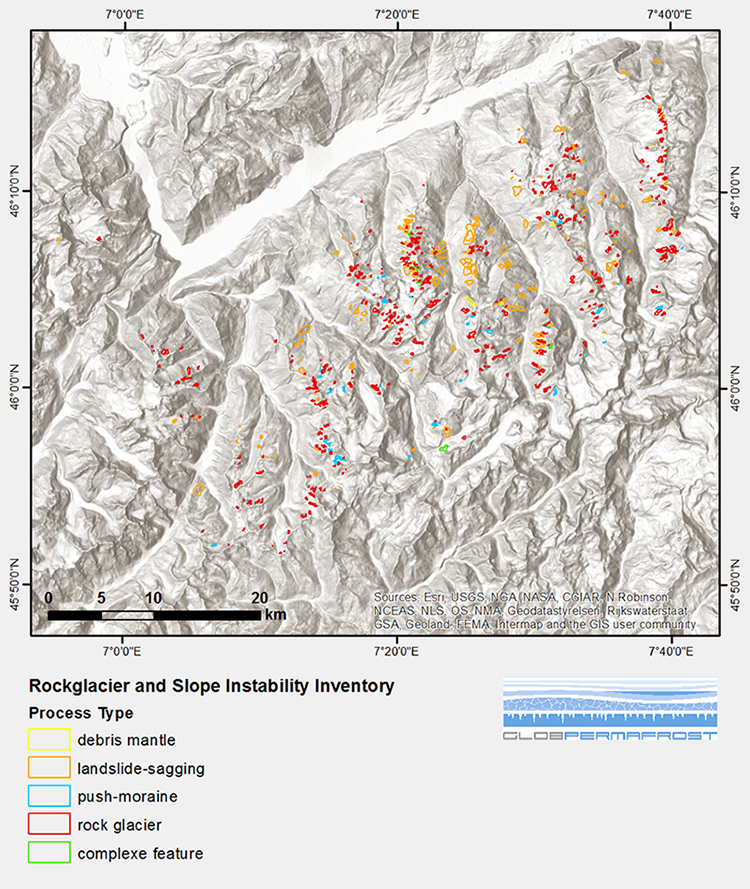
-
Remote sensing-based permafrost region disturbances: lakes, 1999-2014, Eastern Canada (CA)
The data quantify the abundance and distribution of the permafrost region disturbance (PRD) of lakes and their dynamics, using trend analyses of 30-m-resolution Landsat imagery...
-
Remote sensing-based permafrost region disturbances: fire, 1999-2015, Eastern Canada (CA)
The data quantify the abundance and distribution of the permafrost region disturbance (PRD) wildfire, using trend analyses of 30-m-resolution Landsat imagery from 1999-2015 and...
-
Remote sensing-based permafrost region disturbances: retrogressive thaw slumps, 1999-2014, Alaska (US)
The data quantify the abundance and distribution of the permafrost region disturbance (PRD) of retrogressive thaw slumps, using trend analyses of 30-m-resolution Landsat imagery...
-
Remote sensing-based permafrost region disturbances: lakes, 1999-2014, Alaska (US)
The data quantify the abundance and distribution of the permafrost region disturbance (PRD) of lakes and their dynamics, using trend analyses of 30-m-resolution Landsat imagery...
-
Remote sensing-based permafrost region disturbances: fire, 1999-2015, Alaska (US)
The data quantify the abundance and distribution of the permafrost region disturbance (PRD) wildfire, using trend analyses of 30-m-resolution Landsat imagery from 1999-2015 and...
-
Remote sensing-based permafrost region disturbances: fire, 1999-2015, Eastern Siberia (RU)
The data quantify the abundance and distribution of the permafrost region disturbance (PRD) wildfire, using trend analyses of 30-m-resolution Landsat imagery from 1999-2015 and...
-
Remote sensing-based permafrost region disturbances: lakes, 1999-2014, Eastern Siberia (RU)
The data quantify the abundance and distribution of the permafrost region disturbance (PRD) of lakes and their dynamics, using trend analyses of 30-m-resolution Landsat imagery...
-
Remote sensing-based permafrost region disturbances: retrogressive thaw slumps, 1999-2014, Eastern Siberia (RU)
The data quantify the abundance and distribution of the permafrost region disturbance (PRD) of retrogressive thaw slumps, using trend analyses of 30-m-resolution Landsat imagery...
-
Remote sensing-based permafrost region disturbances: fire, 1999-2015, Western Siberia (RU)
The data quantify the abundance and distribution of the permafrost region disturbance (PRD) wildfire, using trend analyses of 30-m-resolution Landsat imagery from 1999-2015 and...
-
Remote sensing-based permafrost region disturbances: lakes, 1999-2014, Western Siberia (RU)
The data quantify the abundance and distribution of the permafrost region disturbance (PRD) of lakes and their dynamics, using trend analyses of 30-m-resolution Landsat imagery...
-
Remote sensing-based permafrost region disturbances: retrogressive thaw slumps, 1999-2014, Western Siberia (RU)
The data quantify the abundance and distribution of the permafrost region disturbance (PRD) of retrogressive thaw slumps, using trend analyses of 30-m-resolution Landsat imagery...
-
Rockglacier and Slope Instability Inventory from differential SAR interferograms and optical imagery, 1998-2016, Broo...
Rockglaciers and other periglacial processes were mapped using visual analysis of differential SAR interferograms and satellite optical images (Google Satellite, Bing Aerial)...
-
Rockglacier and Slope Instability Inventory from differential SAR interferograms and optical imagery, 1998-2016, Tapa...
Rockglaciers and other periglacial processes were mapped using visual analysis of differential SAR interferograms and satellite optical images (Google Satellite, Bing Aerial)...
-
Rockglacier and Slope Instability Inventory from differential SAR interferograms and optical imagery, 1998-2016, Nort...
Rockglaciers and other periglacial processes were mapped using visual analysis of differential SAR interferograms and satellite optical images (Google Satellite, Bing Aerial)...
-
Freeze/Thaw Timing from ENVISAT ASAR GM, 2005-2010, Ob Estuary and Yamal Peninsula, Western Siberia (RU)
The SAR Freeze/Thaw product indicates the timing (day of year) of ground surface freeze-up and thawing at a resolution of 1 km. It is derived from the ENVISAT ASAR sensor...
-
Freeze/Thaw Timing from ENVISAT ASAR GM, 2005-2010, Yakutsk, Central Yakutia (RU)
The SAR Freeze/Thaw product indicates the timing (day of year) of ground surface freeze-up and thawing at a resolution of 1 km. It is derived from the ENVISAT ASAR sensor...
-
Freeze/Thaw Timing from ENVISAT ASAR GM, 2005-2010, Laptev Sea Coast, Laptev and East Siberian Sea Region (RU)
The SAR Freeze/Thaw product indicates the timing (day of year) of ground surface freeze-up and thawing at a resolution of 1 km. It is derived from the ENVISAT ASAR sensor...
-
Freeze/Thaw Timing from ENVISAT ASAR GM, 2005-2010, Mackenzie River Valley and Delta, Beaufort Sea Region (CA)
The SAR Freeze/Thaw product indicates the timing (day of year) of ground surface freeze-up and thawing at a resolution of 1 km. It is derived from the ENVISAT ASAR sensor...
-
Freeze/Thaw Timing from ENVISAT ASAR GM, 2005-2010, Alaska North Slope and Alaska Highway, Alaska (US)
The SAR Freeze/Thaw product indicates the timing (day of year) of ground surface freeze-up and thawing at a resolution of 1 km. It is derived from the ENVISAT ASAR sensor...
